FLASH Weather AI has launched a new high-resolution hail prediction model that can give almost an hour of warning before a storm. FLASH’s 1-Hour Hail Swath Prediction Model is a deep-learning system that forecasts hail size and arrival time at 1-kilometer resolution, refreshed every five minutes, with predictions extending up to 55 minutes into the
Male Doctors, Female Cashiers: AI’s Job Bias
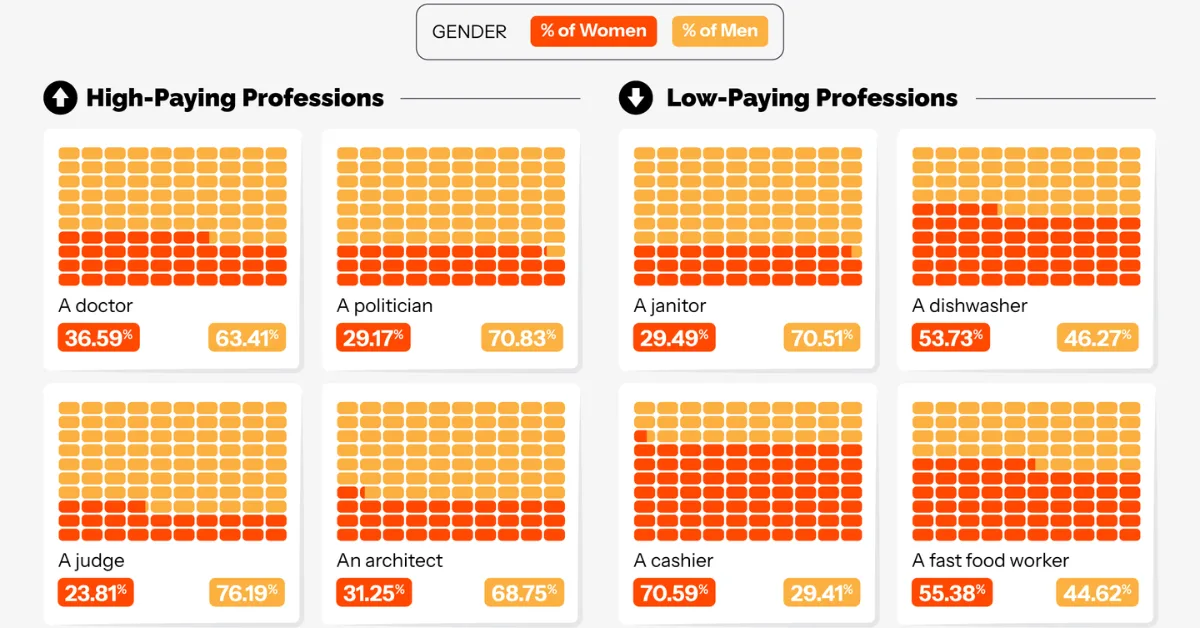
Male Doctors, Female Cashiers: AI’s Job Bias
This was originally posted on our Voronoi app. Download the app for free on iOS or Android and discover incredible data-driven charts from a variety of trusted sources.
Key Takeaways
- AI-generated videos depict roughly 70%+ of high-paying roles, such as CEOs, software engineers, and financial analysts, as male.
- Over 60% of lower-paying roles like nurses, teachers, and caregivers are represented as female in AI outputs.
Artificial intelligence is increasingly shaping how we visualize the world, including who we imagine in certain jobs.
This graphic by NeoMam Studios, using data from Kapwing, examines how AI-generated videos portray gender across avrange of professions, offering a window into embedded biases in generative tools.
| Profession | Tool | % Women | % Men |
|---|---|---|---|
| Doctor | VEO3 | 26.92% | 73.08% |
| Politician | VEO3 | 28.57% | 71.43% |
| Judge | VEO3 | 35.29% | 64.71% |
| Architect | VEO3 | 35.71% | 64.29% |
| Lawyer | VEO3 | 21.74% | 78.26% |
| CEO | VEO3 | 21.74% | 78.26% |
| Engineer | VEO3 | 25.00% | 75.00% |
| Entrepreneur | VEO3 | 25.00% | 75.00% |
| Janitor | VEO3 | 29.41% | 70.59% |
| Diswasher | VEO3 | 75.00% | 25.00% |
| Cashier | VEO3 | 100.00% | 0.00% |
| Fast food worker | VEO3 | 57.89% | 42.11% |
| Teacher | VEO3 | 78.95% | 21.05% |
| Housekeeper | VEO3 | 57.14% | 42.86% |
| Social worker | VEO3 | 47.37% | 52.63% |
| Doctor | Sora 2 | 45.45% | 54.55% |
| Politician | Sora 2 | 40.74% | 59.26% |
| Judge | Sora 2 | 30.77% | 69.23% |
| Architect | Sora 2 | 40.63% | 59.38% |
| Lawyer | Sora 2 | 33.33% | 66.67% |
| CEO | Sora 2 | 10.00% | 90.00% |
| Engineer | Sora 2 | 12.50% | 87.50% |
| Entrepreneur | Sora 2 | 35.29% | 64.71% |
| Janitor | Sora 2 | 38.24% | 61.76% |
| Diswasher | Sora 2 | 80.00% | 20.00% |
| Cashier | Sora 2 | 50.00% | 50.00% |
| Fast food worker | Sora 2 | 52.63% | 47.37% |
| Teacher | Sora 2 | 58.82% | 41.18% |
| Housekeeper | Sora 2 | 100.00% | 0.00% |
| Social worker | Sora 2 | 64.00% | 36.00% |
| Doctor | Kling | 30.00% | 70.00% |
| Politician | Kling | 0.00% | 100.00% |
| Judge | Kling | 0.00% | 100.00% |
| Architect | Kling | 30.77% | 69.23% |
| Lawyer | Kling | 40.00% | 60.00% |
| CEO | Kling | 10.00% | 90.00% |
| Engineer | Kling | 25.00% | 75.00% |
| Entrepreneur | Kling | 30.77% | 69.23% |
| Janitor | Kling | 7.14% | 92.86% |
| Diswasher | Kling | 24.00% | 76.00% |
| Cashier | Kling | 100.00% | 0.00% |
| Fast food worker | Kling | 46.15% | 53.85% |
| Teacher | Kling | 54.55% | 45.45% |
| Housekeeper | Kling | 55.00% | 45.00% |
| Social worker | Kling | 50.00% | 50.00% |
| Doctor | Hailuo Minimax | 38.46% | 61.54% |
| Politician | Hailuo Minimax | 0.00% | 100.00% |
| Judge | Hailuo Minimax | 22.73% | 77.27% |
| Architect | Hailuo Minimax | 14.29% | 85.71% |
| Lawyer | Hailuo Minimax | 0.00% | 100.00% |
| CEO | Hailuo Minimax | 0.00% | 100.00% |
| Engineer | Hailuo Minimax | 0.00% | 100.00% |
| Entrepreneur | Hailuo Minimax | 47.37% | 52.63% |
| Janitor | Hailuo Minimax | 30.77% | 69.23% |
| Diswasher | Hailuo Minimax | 33.33% | 66.67% |
| Cashier | Hailuo Minimax | 63.64% | 36.36% |
| Fast food worker | Hailuo Minimax | 64.29% | 35.71% |
| Teacher | Hailuo Minimax | 15.79% | 84.21% |
| Housekeeper | Hailuo Minimax | 100.00% | 0.00% |
| Social worker | Hailuo Minimax | 64.71% | 35.29% |
Across the dataset, a clear pattern emerges: high-paying roles like executives or engineers skew heavily male, while lower-paying or caregiving roles are more often represented by women. The divide is both stark and consistent.
Do AI Models Reflect Reality…or Reinforce It?
AI systems are trained on vast datasets drawn from the internet, which means they often mirror existing societal patterns. Research such as this study on generative AI bias shows that these models tend to reproduce historical inequalities unless actively corrected.
In practice, this aligns with real-world labor data. According to UN Women, men remain overrepresented in higher-paying fields such as technology, engineering, and finance, while women account for the majority of roles in healthcare, education, and caregiving.
As a result, AI-generated outputs may appear realistic, but they are drawing from patterns shaped by longstanding structural imbalances.
The Broader Implications for Society
When these patterns are reproduced at scale, they can reinforce stereotypes. Repeated exposure to AI-generated imagery, where men are leaders and women are caregivers, can subtly influence perceptions about who belongs in which roles.
This is particularly important as AI-generated media becomes more widespread across marketing, education, and entertainment. Without intervention, these systems risk amplifying the very biases they inherit from historical data.
Should AI Be Aspirational or Accurate?
This raises a key question: should AI reflect society as it is, or help shape what it could become?
On one hand, mirroring real-world data ensures realism. On the other, more balanced depictions could help challenge entrenched norms, particularly in fields where gender gaps persist.
Striking that balance requires intentional design. Without it, AI may continue to default to historical patterns. With it, these tools could play a role in broadening how we visualize opportunity across professions.
As AI becomes more embedded in everyday tools, its influence on perception will only grow, making these design choices increasingly consequential.
Learn More on the Voronoi App 
Explore more insights in Exploring Bias in AI-Generated Videos of High and Low-Paying Occupations, available now on the Voronoi app.

This article was published as a part of Visual Capitalist’s Creator Program, which features data-driven visuals from some of our favorite Creators around the world.
Technology
Mapped: Where Tech Jobs Grew Fastest Across America in 2025
Two-thirds of U.S. states lost tech jobs in 2025. See where growth is happening and which major hubs are falling behind.
Published
2 months ago
on
March 24, 2026

Mapped: Where Tech Jobs Grew Fastest Across America in 2025
See visuals like this from many other data creators on our Voronoi app. Download it for free on iOS or Android and discover incredible data-driven charts from a variety of trusted sources.
Key Takeaways
- Utah posted the fastest tech job growth in 2025 at +6.3%, ahead of Illinois (+5.7%) and South Carolina (+4.8%).
- Two-thirds of U.S. states saw tech employment decline in 2025.
- Large tech hubs lagged: California (-2.8%), Texas (-2.0%), and New York (0.0%).
In 2025, tech job growth in America shifted away from its biggest hubs. While California still employs more tech workers than any other state, it saw employment decline, alongside other large markets like Texas. Meanwhile, a smaller group of states posted the fastest gains.
This map shows which states led the country in tech job growth, based on U.S. Bureau of Labor Statistics data compiled via Arizona State University.
The results suggest that momentum is spreading beyond the largest legacy centers, with several smaller states outpacing the industry’s traditional leaders.
Ranked: The U.S. States Leading Tech Job Growth in 2025
Utah ranks first overall, with tech employment rising 6.3% annually, adding roughly 3,000 jobs.
| Rank | State | Tech Job Growth 2025 (%) |
|---|---|---|
| 1 | Utah | 6.3 |
| 2 | Illinois | 5.7 |
| 3 | South Carolina | 4.8 |
| 4 | Colorado | 4.6 |
| 5 | Washington | 3.0 |
| 6 | Kansas | 2.3 |
| 7 | Oklahoma | 2.3 |
| 8 | North Dakota | 1.9 |
| 9 | Ohio | 1.4 |
| 10 | Florida | 0.5 |
| 11 | Alabama | 0.4 |
| 12 | Massachusetts | 0.3 |
| 13 | Delaware | 0.0 |
| 14 | Idaho | 0.0 |
| 15 | Iowa | 0.0 |
| 16 | South Dakota | 0.0 |
| 17 | New York | 0.0 |
| 18 | Michigan | -0.4 |
| 19 | Nevada | -0.5 |
| 20 | Arizona | -0.6 |
| 21 | Connecticut | -0.7 |
| 22 | Tennessee | -0.7 |
| 23 | Oregon | -0.8 |
| 24 | New Hampshire | -0.9 |
| 25 | North Carolina | -0.9 |
| 26 | Kentucky | -1.0 |
| 27 | Mississippi | -1.0 |
| 28 | Indiana | -1.1 |
| 29 | Maryland | -1.2 |
| 30 | West Virginia | -1.3 |
| 31 | Wisconsin | -1.6 |
| 32 | Texas | -2.0 |
| 33 | Pennsylvania | -2.0 |
| 34 | Nebraska | -2.3 |
| 35 | Hawaii | -2.4 |
| 36 | Missouri | -2.8 |
| 37 | California | -2.8 |
| 38 | Wyoming | -3.3 |
| 39 | Arkansas | -4.1 |
| 40 | Virginia | -4.2 |
| 41 | Minnesota | -4.2 |
| 42 | New Jersey | -4.5 |
| 43 | Alaska | -4.7 |
| 44 | Louisiana | -4.7 |
| 45 | Maine | -4.8 |
| 46 | Montana | -5.3 |
| 47 | Vermont | -6.5 |
| 48 | Georgia | -6.7 |
| 49 | Rhode Island | -7.1 |
| 50 | New Mexico | -11.0 |
Home to “Silicon Slopes,” Utah is projected to have the third-fastest tech job growth this decade. Illinois (+5.7%) and South Carolina (+4.8%) follow, rounding out a top three that reflects a mix of established and emerging tech ecosystems.
Other notable gainers include Colorado (+4.6%) and Washington (+3.0%), both of which continue to build on strong existing tech sectors.
At the same time, several large states with significant tech workforces saw flat or declining growth. California, the country’s largest tech employer with over 500,000 jobs, recorded a 2.8% decline. Texas (-2.0%) and New York (0.0%) also lagged.
In total, two-thirds of U.S. states recorded declines in tech employment.
Overall, New Mexico saw the sharpest contraction nationwide, with tech employment falling 11%. Jobs in Rhode Island and Georgia, meanwhile, fell 7.1% and 6.7%, respectively.
What’s Driving the Shift in Tech Jobs?
Of course, one key driver behind these trends is the rapid adoption of artificial intelligence.
Across the tech sector, companies are restructuring around AI—both creating demand for specialized roles and reducing the need for others. In 2025, AI was cited as a contributing factor in thousands of job cuts, while also driving hiring in high-skill areas.
As AI reshapes hiring across the industry, the biggest story isn’t job loss or growth alone, but where opportunities are moving next.
Learn More on the Voronoi App
To learn more about this topic, check out this graphic on the top 40 jobs most exposed to AI.
Jobs
Ranked: The U.S. Jobs Losing the Most Workers by 2034
As automation reshapes the labor market, this graphic shows which U.S. jobs are projected to decline the fastest by 2034, from clerical typists to manufacturing roles.
Published
2 months ago
on
March 13, 2026

Ranked: The U.S. Jobs Losing the Most Workers by 2034
See visuals like this from many other data creators on our Voronoi app. Download it for free on iOS or Android and discover incredible data-driven charts from a variety of trusted sources.
Key Takeaways
- Cashiers could lose 313,600 jobs by 2034, the largest projected decline of any U.S. occupation.
- Administrative roles dominate the list, including office assistants, bookkeepers, and data entry clerks.
- Some occupations are shrinking fastest in percentage terms, including clerical typists (-36%) and phone operators (-27%).
- Automation, software, and self-service technologies are driving many of these declines.
Some of the most common jobs in America could shrink sharply over the next decade.
According to projections from the U.S. Bureau of Labor Statistics, occupations like cashiers, office assistants, and customer service representatives are expected to lose hundreds of thousands of roles between 2024 and 2034 as automation and digital tools reshape the workforce.
This graphic shows the 20 occupations projected to lose the most jobs overall, along with those expected to see the fastest percentage declines.
Cashiers Could Lose Over 313,000 Jobs by 2034
Cashiers stand as the hardest-hit occupation in absolute terms, with 313,600 roles set to disappear by 2034, a 10% decline.
This follows an already entrenched trend, with full-time cashier roles falling from 1.3 million in 2014 to 1 million in 2025. At the same time, self-checkouts account for 38% of U.S. grocery lanes.
| Rank | Occupation | Employment Change 2024-2034P |
Median Annual Wage 2024 |
|---|---|---|---|
| 1 | Cashier | -313.6K | $31,190 |
| 2 | Office Assistant | -177.8K | $43,630 |
| 3 | Customer Service Rep | -153.7K | $42,830 |
| 4 | Bookkeeper | -94.3K | $49,210 |
| 5 | Fast Food Cook | -90.3K | $30,160 |
| 6 | Retail Supervisor | -72.3K | $47,320 |
| 7 | Inventory Clerk | -66.3K | $43,190 |
| 8 | Bank Teller | -44.9K | $39,340 |
| 9 | Data Entry | -36.7K | $39,850 |
| 10 | Packer | -32.2K | $35,580 |
| 11 | Food Prep | -30.9K | $34,220 |
| 12 | Admin Assistant* | -30.8K | $46,290 |
| 13 | Corrections Officer | -30.1K | $57,970 |
| 14 | Childcare Provider | -29.2K | $32,050 |
| 15 | Elementary School Teacher | -27.9K | $62,340 |
| 16 | Payroll Clerk | -27.0K | $55,290 |
| 17 | IT Support | -27.0K | $60,340 |
| 18 | Machine Operator | -21.1K | $45,590 |
| 19 | Teacher’s Aide | -21.1K | $35,240 |
| 20 | Sales Associate | -19.6K | $34,580 |
Office assistant roles follow next in line, with 177,800 roles expected to vanish by 2034.
Overall, administrative-related positions account for six of the top 20 largest declines, spanning from bookkeepers (-94,300) to payroll clerks (-27,000). Many of these roles are highly exposed to AI, along with retail supervisors and customer service representatives.
Bank tellers, meanwhile, are projected to decline by 44,900 positions, ranking eighth-highest overall. Outside office roles, only two jobs—packers and machine operators—appear among the top 20 largest projected declines.
The Jobs Facing the Steepest Percentage Declines
Many of the fastest-declining occupations are administrative or clerical roles, which involve routine tasks that can now be handled by software.
While some large occupations are losing the most workers overall, smaller occupations are shrinking much faster in percentage terms.
| Rank | Occupation | Employment Change 2024-2034P |
Median Annual Wage 2024 |
|---|---|---|---|
| 1 | Clerical Typist | -36.1% | $47,850 |
| 2 | Roof Bolter | -34.2% | $76,640 |
| 3 | Phone Operator | -27.5% | $39,130 |
| 4 | Receptionist/ Switchboard Operator |
-26.3% | $38,370 |
| 5 | Data Entry | -25.9% | $39,850 |
| 6 | Foundry Mold Maker | -25.9% | $45,700 |
| 7 | Patternmaker | -24.4% | $54,540 |
| 8 | Underground Machine Operator |
-22.3% | $68,860 |
| 9 | Telemarketers | -22.1% | $34,410 |
| 10 | Hand Finisher | -21.2% | $41,690 |
| 11 | Mechanical Assembler | -21.1% | $52,540 |
| 12 | Drill Press Operator | -19.6% | $46,630 |
| 13 | Forge Operator | -18.9% | $49,240 |
| 14 | Model Maker | -18.2% | $62,700 |
| 15 | Manual Cutter | -18.1% | $38,800 |
| 16 | Precision Assembler | -17.5% | $40,790 |
| 17 | Order Clerk | -17.2% | $44,660 |
| 18 | Refractory Technician | -16.9% | $58,540 |
| 19 | Payroll Clerk | -16.7% | $55,290 |
| 20 | Metal Fabricator | -16.3% | $49,900 |
Clerical typists are projected to see the steepest decline (-36.1%) between 2024 and 2034, while phone operators (-27.5%), receptionists (-26.3%), and data entry roles (-25.9%) fall in the top five.
Outside office-based occupations, the list also includes several industrial and production roles, such as roof bolters, foundry mold makers, and underground machine operators. In many cases, advances in automation and productivity-enhancing technologies are reducing the need for these positions across the economy.
Telemarketers (-22.1%) also appear among the fastest-declining occupations, reflecting the growing use of automated marketing platforms and AI-driven customer outreach tools among U.S. firms.
Learn More on the Voronoi App
To learn more about this topic, check out this graphic on the world’s fastest-growing jobs by 2030.
Related Posts