When you buy through links on our articles, Future and its syndication partners may earn a commission. Credit: Picture it: a suited exec walks onto a stage and announces a new game about influencing and controlling people, about good and evil. And the clincher: it'll all be driven by machine learning. In 2026, that game
AI-driven diagnosis of mpox using deep learning models – PMC
Abstract
Mpox lesions can resemble other dermatological conditions, motivating image-based screening, yet published studies remain difficult to compare owing to differences in dataset construction, augmentation policy, and evaluation design. This study provides a leakage-aware benchmark for binary mpox classification using a unified dataset assembled from MSLD v1.0 and v2.0. Seven pretrained backbones and a weighted ensemble were compared under group-stratified five-fold cross-validation with original-only test evaluation, validation-based threshold selection, and temperature scaling. The weighted ensemble achieved mean accuracy 0.8729, F1-score 0.8334, and AUC 0.9388; ConvNeXt-Tiny was the strongest single model (F1 0.8159, AUC 0.9284). These grouped original-only results are intentionally conservative relative to augmentation-heavy or single-split designs and should be interpreted as deflated but more trustworthy reference values. Post hoc calibration analysis, content-level near-duplicate auditing, and a test-time augmentation ablation are provided to substantiate the methodological claims. The contribution is methodological: a transparent benchmark emphasizing reproducible dataset curation, grouped evaluation, and calibrated comparison, while highlighting the limitations of current public skin-image data. Accordingly, these results should be interpreted as a reproducible reference benchmark rather than a clinically validated diagnostic tool, and external clinical validation remains necessary before deployment.
1 Introduction
Mpox is a zoonotic disease caused by monkeypox virus (MPXV), an orthopoxvirus related to variola virus and other members of the same genus. Typical manifestations include fever, headache, myalgia, lymphadenopathy, and vesiculopustular skin lesions, but diagnosis based on clinical appearance alone may be difficult because mpox lesions can resemble other rash-associated conditions such as chickenpox, measles, and other vesicular or pustular disorders [1,2]. Laboratory confirmation therefore remains central to case verification, and lesion-derived material analysed by nucleic acid amplification testing, particularly PCR-based testing, is regarded as the reference diagnostic approach [2]. At the same time, the visual nature of many mpox manifestations has motivated interest in image-based decision-support systems as adjunct tools for preliminary screening in settings where rapid specialist assessment may be limited.
Artificial intelligence, and especially deep learning, has been increasingly explored for mpox-related tasks, ranging from public-health surveillance through social-media sentiment analysis [3] to diagnostic imaging from skin lesions. Chadaga et al. systematically reviewed artificial intelligence applications for mpox and identified diagnostic imaging as one of the main research directions in the field [4]. Early lesion-image studies showed that pretrained models could provide useful discrimination on public datasets [5,6], while later studies expanded the comparison space through transfer learning on multiple datasets and ensemble learning [7,8]. These studies established the feasibility of computer-aided mpox screening from lesion images, but they also exposed a persistent problem: model results are difficult to compare directly because datasets, augmentation policies, class definitions, and validation protocols vary substantially across papers.
Recent work has made this limitation explicit. Hossain et al. argued that poor dataset quality, weak generalizability, lesion variability, image noise, unsuitable augmentation, and inconsistent benchmarking remain major barriers to reliable mpox diagnosis from skin images [9]. This concern is reinforced by Vega et al. who showed that some early publicly shared mpox skin-image datasets contained flawed or medically irrelevant web-scraped content, underscoring the need for explicit curation and evaluation rules [10]. For this reason, the key need is not simply another high headline accuracy, but a benchmark in which dataset assembly, group handling, training policy, threshold selection, and evaluation are documented clearly enough to permit defensible interpretation.
The methodological choice of transfer learning with pretrained backbones is motivated by three practical considerations specific to the mpox imaging domain. First, the total number of publicly available original mpox lesion images remains small (on the order of a few hundred), which makes training deep architectures from scratch prone to severe overfitting; transfer learning from ImageNet-pretrained weights mitigates this by providing a robust feature initialization that generalizes well to medical texture and colour cues with limited fine-tuning data [4]. Second, different backbone families encode complementary inductive biases: convolutional networks such as ConvNeXt-Tiny and MobileNetV3-Large emphasize local texture and spatial hierarchy, whereas vision transformers such as ViT-B/16 capture long-range dependencies across the image. The extent to which these biases are advantageous for lesion recognition under heterogeneous acquisition conditions is an empirical question that the present benchmark is designed to address. Third, weighted ensembling is included because prior mpox studies have shown that combining diverse classifiers can improve robustness when no single model dominates across all operating metrics [5,8], and the present protocol provides a controlled setting to quantify this gain under stricter evaluation conditions.
Against this background, the present study investigates binary mpox image classification using a unified curated dataset assembled from MSLD v1.0 and MSLD v2.0 under explicit selection and class-mapping rules. The benchmark compares seven pretrained backbones and a weighted ensemble under a common protocol that emphasizes group-aware splitting, evaluation on original images only, controlled use of augmented data during training, validation-based threshold selection, and fold-wise reporting.
The objectives of this study are threefold. First, it aims to construct a unified curated binary dataset for mpox skin-image classification with fully specified class-mapping and selection rules. Second, it aims to compare multiple pretrained transfer-learning models and an ensemble strategy under a shared training and evaluation pipeline. Third, it aims to examine how dataset construction and leakage-aware evaluation influence the interpretation of performance on public mpox lesion data. The contribution is therefore methodological rather than architectural: the study does not introduce a new backbone, but instead provides a unified curation recipe, a leakage-aware validation design, and fold-wise reference results intended to support more defensible comparison with prior and future mpox skin-image studies.
Accordingly, the study addresses the following research questions:
-
RQ1. Under a shared group-aware evaluation protocol, which pretrained backbone provides the most reliable performance for binary mpox image classification?
-
RQ2. Does weighted ensembling provide a consistent advantage over individual backbones when testing is restricted to original images and summarized across cross-validation folds?
-
RQ3. What do the results reveal about the current strengths and limitations of publicly available mpox skin-image datasets for reproducible artificial-intelligence benchmarking?
2 Related work
Recent peer-reviewed work on mpox image analysis has focused mainly on transfer learning with pretrained convolutional neural networks, with some studies extending this direction toward mobile deployment, customized hybrid models, dataset curation, and ensembling [4]. Because the literature spans binary classification, multiclass differential diagnosis, and even broader mpox-related artificial-intelligence applications, direct comparison of headline accuracies requires careful attention to task definition, dataset composition, augmentation policy, and validation design.
Among the early lesion-image studies, Sitaula and Shahi compared 13 pretrained deep-learning models and then combined selected models using majority voting; their ensemble achieved 85.44% precision, 85.47% recall, 85.40% F1-score, and 87.13% accuracy on a publicly available lesion dataset [5]. Sahin et al. developed a mobile screening application and reported 91.11% test accuracy, together with average inference times of 197 ms, 91 ms, and 138 ms on three mobile devices [6]. These studies established the feasibility of mpox screening from skin images, but they were based on early public datasets and relatively simple binary pipelines.
Subsequent studies diversified both the datasets and the modelling strategies. MonkeyNet, introduced by Bala et al., combined a newly compiled multiclass lesion dataset with a modified DenseNet-201 and reported 93.19% accuracy on the original data and 98.91% on the augmented data [11]. Altun et al. reported that a customized MobileNetV3-s transfer-learning model achieved an average F1-score of 0.98, AUC of 0.99, and accuracy of 0.96 [12]. Uysal proposed a hybrid deep-learning system that combined high-performing CNNs with LSTM and reported 87% test accuracy with Cohen’s kappa of 0.8222 on a four-class dataset [13]. Azar et al. evaluated seven deep neural networks under both two-class and four-class settings; their DenseNet201-based architecture reached 97.63% accuracy in the two-class scenario and 95.18% in the four-class scenario [14].
Other studies emphasized explainability, efficient deployment, or broader dataset coverage. Thieme et al. developed a deep-learning algorithm for classifying mpox skin lesions and validated it on a geographically diverse clinical dataset, achieving strong discrimination and highlighting the potential for AI-assisted triage in clinical settings [15]. Nayak et al. reported an average accuracy of 91.19% and an Mpox-class F1-score of 92.55% in a four-class explainable-AI study based on residual networks and SqueezeNet [16]. In a related study using five efficient CNN backbones, the same group reported 99.49% validation accuracy for a ResNet-18-based classifier on a public binary dataset and highlighted the suitability of the models for smartphone-like devices [17]. Almufareh et al. evaluated transfer learning on two public lesion datasets and showed that model ranking changed across datasets: MobileNetV2 achieved the best accuracy on MSID (0.96), whereas InceptionV3 achieved the best accuracy on MSLD (0.9333) [7]. Pramanik et al. proposed an amalgamation of CNN models aided with Beta function-based normalization for mpox detection from skin lesion images and reported strong classification performance on a public dataset [18]. Muñoz-Saavedra et al. extended the field toward ensemble learning and reported that single networks reached 93% accuracy whereas a three-network ensemble reached 98.33% accuracy in a three-class setting [8]. Bamaqa et al. later combined transfer learning with Sparrow Search Algorithm optimization and reported 99.87% accuracy for an optimized VGG19 model on two public datasets, although their binary task merged multiple pox-like conditions into a single positive class [19]. Aslam et al. proposed a deep transfer-learning approach for mpox recognition from visual images, further demonstrating the viability of pretrained networks in this domain [20].
Table 1 summarizes representative peer-reviewed studies together with the task setting, dataset context, validation strategy, best reported result, and the main reason why direct comparison with the present benchmark remains limited. Reporting these elements together is essential because published headline figures often depend strongly on class structure, augmentation policy, and whether performance is reported on validation or held-out test data.
Table 1. Standardized comparison of representative peer-reviewed mpox skin-image studies.
| Study | Task / dataset | Split / validation | Best reported result | Comparability limitation |
|---|---|---|---|---|
| Sitaula and Shahi (2022) [5] | Binary mpox/non-mpox classification using 13 pretrained models plus an ensemble. Dataset: 1 754 augmented images from four categories (587 mpox, 552 normal, 329 chickenpox, 286 measles), later remapped to binary. | Random 5-fold cross-validation. | Ensemble: precision 85.44%, recall 85.47%, F1 85.40%, accuracy 87.13%. | Binary evaluation performed on an augmented four-class pool remapped to two classes; data-generation policy differs from the present benchmark. |
| Sahin et al. (2022) [6] | Binary mobile screening on MSLD. Original set: 228 images (102 mpox, 126 non-mpox), expanded by augmentation to 1 428 mpox and 1 764 non-mpox images. | Single predefined Fold1 split provided by the MSLD repository; original images divided at approximately 70/10/20 for training, validation, and test with patient independence maintained. | Test accuracy 91.11%; mobile inference times 197, 91, and 138 ms. | Mobile deployment study evaluated on a single early split rather than repeated cross-validation. |
| Bala et al. (2023) [11] | Four-class classification (chickenpox, measles, mpox, normal). Original dataset: 770 images; augmented dataset: 8 689 images. | 80:20 training-to-test split; 20% of the training portion reserved for validation. | Original data: 93.19%. Augmented data: 98.91%. | Multiclass design and separate original/augmented reporting make the headline accuracy non-comparable to a binary original-only benchmark. |
| Altun et al. (2023) [12] | Binary optimized transfer-learning CNN on a custom web-scraped dataset. Total: 2 056 images; training: 1 742; validation: 158; test: 156. | Held-out test set; a validation subset was drawn from training data during hyperparameter optimization. | Optimized hybrid MobileNetV3-s: average F1 0.98, AUC 0.99, accuracy 0.96, recall 0.97. | Custom hybrid architecture and custom web-scraped dataset; no shared public benchmark protocol. |
| Uysal (2023) [13] | Four-class hybrid CNN-LSTM study. Original dataset: 770 images (293 normal, 279 mpox, 91 measles, 107 chickenpox); augmented and balanced to 1 200 images. | 80/10/10 training, validation, and test after preprocessing and augmentation. | Test accuracy 87%; Cohen’s kappa 0.8222. | Balanced multiclass augmented dataset and hybrid CNN-LSTM architecture differ markedly from the current binary grouped protocol. |
| Azar et al. (2023) [14] | Two-class and four-class lesion classification using seven DNNs. Dataset: 1 710 images from four classes; both binary remapping and four-class analysis were reported. | 10-fold cross-validation with hyperparameter optimization. | Two-class: DenseNet201 97.63%. Four-class: 95.18%. | Different source dataset; two task formulations evaluated within a single study complicate single-point comparison. |
| Nayak et al. [16] | Four-class explainable-AI study using ResNet-50, ResNet-18, ResNet-10, and SqueezeNet on MSID. Dataset: 770 images (107 chickenpox, 91 measles, 279 mpox, 293 normal). | Training and validation splits used; the paper reports peak validation accuracy of 95.42% for the best trial. The exact fold count or hold-out ratio is not clearly recoverable from the accessible full text. | Average accuracy 91.19%; mpox-class F1 92.55%. | Class-wise F1 in a four-class explainable-AI setting is not directly comparable with global binary metrics. |
| Nayak et al. [17] | Binary classification using five pretrained networks on MSLD. Dataset: 228 images (102 mpox, 126 others) resized to . | Training and validation split with hyperparameter tuning; reported 99.49% is a validation accuracy (all models reached 100% training accuracy). No separate held-out test set is described in the accessible full text. | ResNet-18 validation accuracy 99.49%; sensitivity 99.43%, specificity 100%. | Headline accuracy is a validation figure obtained during hyperparameter search; absence of a leakage-aware held-out test split limits comparability. |
| Almufareh et al. (2023) [7] | Binary transfer learning on two public datasets. MSLD: 228 images (102 mpox, 126 others). MSID: 477 images after binary remapping (279 mpox, 198 others); note that the original MSID contains 770 four-class images, and the 477-image count reflects the subset reported by the authors after their specific preprocessing. | Augmentation applied; early stopping used during training. The specific training, validation, and test split ratio is not reported in the accessible full text. | MSID, MobileNetV2: accuracy 0.96, balanced accuracy 0.9655. MSLD, InceptionV3: accuracy 0.9333, balanced accuracy 0.94. | Model ranking reverses across datasets, limiting any single leaderboard-style comparison; split protocol not recoverable. |
| Muñoz-Saavedra et al. (2023) [8] | Three-class classification (mpox, healthy, other skin disease). Custom public dataset: 300 images total, balanced at 100 images per class. | 60:20:20 training, validation, and test split. | Single network: 93%. Three-network ensemble: 98.33%. | Three-class custom dataset with its own collection and balance rules; not a direct binary comparator. |
| Bamaqa et al. (2024) [19] | Binary normal-vs.-pox classification on two public datasets (42 162 images total). The positive class pooled mpox, chickenpox, smallpox, cowpox, and measles into one “pox” label. | Comparative optimization study over multiple search strategies. A patient-aware or grouped split protocol is not stated in the indexed abstract or highlights. | SpaSA-optimized VGG19: accuracy 99.87%. | Positive class is broader than mpox alone; optimization target differs from a standard mpox-only lesion benchmark. |
| Elhadidy et al. (2025) [21] | Multiclass benchmarking on MSLD v2.0 using five pretrained CNN and Transformer backbones. The study used the single-source six-class MSLD v2.0 dataset with augmentation to improve robustness. | The accessible abstract reports validation accuracy after augmentation-based training, but the exact split design is not fully recoverable from the indexed source text. | Xception: 99.92% validation accuracy. | Single-source multiclass benchmark centered on validation accuracy; it does not address cross-source unification or original-only grouped evaluation. |
| Present study (2025) | Binary classification on a unified dataset from MSLD v1.0 and v2.0. 876 original images (339 mpox, 537 non-mpox); 1 357 with augmented. Seven pretrained backbones + weighted ensemble. | Group-stratified 5-fold cross-validation on original images only. Augmented images used during training only. Validation-based threshold selection and temperature scaling per fold. | Weighted ensemble: F1 0.8334 ± 0.0432, AUC 0.9388 ± 0.0203. Best single model (ConvNeXt-Tiny): F1 0.8159 ± 0.0727. | Intentionally conservative protocol; results are lower than augmentation-heavy single-split studies but are designed for reproducibility and cross-study comparability. |
Taken together, the literature shows that mpox image classification is technically feasible and that strong performance can be obtained under several settings. At the same time, public datasets remain heterogeneous, and recent critique has made clear that benchmarking practices are not yet sufficiently standardized [9,10]. Recent MSLD v2.0 benchmarking work also continues to report very high validation accuracy under single-source, augmentation-based protocols [21]. The present study is positioned within this gap. Rather than proposing a new architecture, it focuses on transparent dataset construction from MSLD v1.0 and MSLD v2.0, explicit group handling, original-only test evaluation, within-fold calibration, and fold-wise reporting under a shared protocol, thereby providing a clearer basis for comparing transfer-learning backbones and weighted ensembling on a unified curated binary benchmark.
3 Materials and methods
3.1 Study design
This study was designed as a reproducible benchmarking and methodological-validation study for binary mpox skin-image classification using transfer learning. The benchmark combined multiple public lesion-image resources under explicit class-mapping rules and evaluated all models using group-stratified 5-fold cross-validation. Augmented images were allowed during training under controlled sampling, but all validation-driven model selection and all reported test metrics were tied to original-image evaluation only. Post hoc temperature scaling was applied within each fold, and a weighted ensemble was optimized on validation predictions. The study should therefore be interpreted as a validation-oriented benchmarking exercise: its primary aim is to reduce optimistic bias and improve comparability across models, not to claim a novel diagnostic architecture.
3.2 Unified dataset construction
The unified benchmark incorporated MSLD v1.0 and MSLD v2.0 [7,22]. For MSLD v1.0, the binary mapping followed the folder structure Monkey Pox versus Others for original images and Monkeypox_augmented versus Others_augmented for augmented images. For MSLD v2.0, only the Monkeypox class was mapped to the positive label, whereas Chickenpox, Cowpox, Healthy, HFMD, and Measles were merged into the negative label. To avoid contaminating the benchmark with a predefined external test split, only the Train and Valid subsets of MSLD v2.0 were used in the reported experiments.
Source prefixes (v1__ and v2__) were attached during dataset materialization to preserve provenance and avoid filename collisions. The final original-image pool used to define cross-validation folds contained 876 images, corresponding to 339 mpox and 537 non-mpox images. After controlled inclusion of augmented images, the combined pre-fold pool of original and augmented images contained 1,357 samples, of which 876 were original. Table 2 summarizes the unified dataset construction, class mapping, and inclusion rules.
Table 2. Unified dataset construction rules.
| Source | Positive mapping | Negative mapping | Inclusion rule |
|---|---|---|---|
| MSLD v1.0 [7] | Monkey Pox / Monkeypox augmented | Others / Others augmented | All readable files in the designated folders |
| MSLD v2.0 [22] | Monkeypox | Chickenpox, Cowpox, Healthy, HFMD, and Measles | Only the Train and Valid subsets from folds 1–5 |
3.3 Leakage control, grouping, and split policy
Data splitting was based on original images only. Augmented images were excluded from fold construction and from all reported test evaluations. This design ensured that the benchmark never reported final performance on synthetic variants. During dataset preparation, augmented images were capped at three variants per inferred group (max_aug_per_group = 3), following the common practice of limiting augmentation multiplicity to avoid overfitting to synthetic variants [23], and the training mixture was downsampled so that original images represented approximately 70% of the combined training pool (train_orig_ratio = 0.7), a ratio chosen to preserve the distributional characteristics of the original acquisition conditions while still benefiting from augmented diversity. In addition to filename-based grouping, a post hoc content-level near-duplicate audit was conducted using 64-bit perceptual hashing (pHash) computed over all 876 original images. Image pairs whose Hamming distance fell at or below a conservative threshold of 10 (out of 64 bits, corresponding to approximately 84% bit agreement) were flagged as candidate near-duplicates; this threshold is consistent with the range of 8–12 commonly used in perceptual-hash-based duplicate detection [24]. The audit identified 95 candidate pairs; the vast majority (more than 80) had a Hamming distance of exactly zero, indicating perceptually identical content. Inspection revealed that nearly all pairs consist of the same image present in both MSLD v1.0 and v2.0 under different filename conventions (e.g., v1__M01_04.jpg ↔ v2__MKP_01_04.jpg), confirming that the two dataset versions share a substantial overlapping core. Three additional intra-source near-duplicate pairs were detected within MSLD v2.0 itself (CWP_02 ↔ CWP_31, HEALTHY_21 ↔ HEALTHY_77, HFMD_130 ↔ HFMD_96). Crucially, in every one of the 95 identified pairs both members belonged to the same filename-derived group and therefore to the same cross-validation fold, yielding zero cross-fold leaks. Leakage control therefore rests on three complementary layers: source prefixing, filename-based grouping with original-only fold construction, and verified content-level deduplication.
The reported experiments used group_stratified splitting with 5 folds and an internal validation fraction of 0.20. Group identifiers were inferred with a filename-based regular expression that stripped optional source prefixes (for example, v1__) together with augmentation suffixes such as _ORIGINAL and numeric variant tags. This grouping rule kept related filenames within the same fold. The final run identified 617 groups, with an average of 1.42 images per group and a maximum of 14 images per group. A filename-based leakage sanity check indicated that no derived leakage identifier was present in more than one split during the reported cross-validation run.
3.4 Compared models
Seven pretrained backbones were evaluated: EfficientNetV2-S [25], ConvNeXt-Tiny [26], ViT-B/16 [27], ResNet-50 [28], DenseNet-121 [29], EfficientNet-B0 [30], and MobileNetV3-Large [31]. All models were trained at an input resolution of pixels.
3.5 Shared training and evaluation protocol
All experiments used a batch size of 16, a maximum of 30 epochs, mixed-precision training, two data-loading workers, and a weighted sampler. The shared training mode was original+aug, whereas validation and test evaluation used original images only. Online image augmentation was disabled because the benchmark already included a curated augmented-image pool. After the main training stage, each model was fine-tuned on original images only for 5 epochs at a learning rate of .
Early stopping used f1_at_precision as the monitored metric, with patience set to 4 epochs. Validation-based threshold selection used the same f1_at_precision strategy with a precision target of 0.80 and a minimum recall target of 0.85. Probability calibration was performed by temperature scaling [32] fitted on the validation subset of each fold. At test time, 16-fold test-time augmentation was enabled for all backbones. Table 3 provides a compact summary of the shared training and evaluation settings.
Table 3. Shared training and evaluation settings.
| Setting | Value |
|---|---|
| Cross-validation folds | 5 |
| Validation fraction within each fold | 0.20 |
| Split strategy | Group-stratified |
| Splitting base | Original images only |
| Training mix | Original + augmented |
| Original-image ratio in training mix | 0.70 |
| Maximum augmented variants per group | 3 |
| Input size | |
| Batch size | 16 |
| Maximum epochs | 30 |
| Fine-tuning stage | Original-only |
| Fine-tuning epochs / learning rate | 5 / |
| Mixed precision | Enabled |
| Weighted sampler | Enabled |
| Threshold strategy | f1_at_precision |
| Precision target / minimum recall | 0.80 / 0.85 |
| Calibration | Temperature scaling |
| Test-time augmentation | 16-fold |
3.6 Multi-objective hyperparameter selection
Backbone-specific hyperparameters were selected using multi-objective optimization (MOO) based on Optuna/NSGA-II [33]. The three objectives were to maximize AUC, maximize F1 at the precision-constrained threshold, and minimize log loss. The search used a population size of 8, 3 generations, and 6 evaluation epochs, corresponding to 24 trials per backbone and per fold. Feasibility constraints required precision ≥ 0.80, AUC ≥ 0.80, and F1 ≥ 0.80, and candidate selection used the f1_at_precision_first rule.
The tuned search space included learning rate, weight decay, label smoothing, MixUp alpha, CutMix alpha, loss type, focal-loss alpha and gamma, optimizer, scheduler, warmup duration, drop-path rate, gradient clipping norm, and classifier-head learning rate. To avoid notation ambiguity, the subscripted symbols and in Table 4 denote the focal-loss class-weight and focusing parameters, respectively, whereas and in Table 5 denote the Beta-distribution concentration parameters for MixUp and CutMix augmentation. In the reported run, the same configuration was selected for a given backbone in all five folds, so Tables 4 and 5 report the exact selected settings used during cross-validation. The exported tuning records assigned identical selected settings to ResNet-50 and DenseNet-121 in this run; these values are reported verbatim from the recorded outputs obtained under the shared search space and selection rule.
Table 4. Selected backbone-specific optimization and loss hyperparameters.
| Model | LR | WD | Label smooth. | Loss | Focal | Focal | Optimizer | Scheduler |
|---|---|---|---|---|---|---|---|---|
| EfficientNetV2-S | 3.9 038 × 10-4 | 1.2 503 × 10-5 | 0.0701 | focal | 0.3221 | 2.4771 | AdamW | plateau |
| ConvNeXt-Tiny | 3.0 550 × 10-5 | 3.8 194 × 10-6 | 0.0701 | focal | 0.3531 | 2.1184 | AdamW | plateau |
| ViT-B/16 | 3.0 550 × 10-5 | 1.0 569 × 10-5 | 0.0940 | focal | 0.4070 | 2.1184 | Adam | plateau |
| ResNet-50 | 5.9 540 × 10-5 | 1.3 315 × 10-4 | 0.0547 | ce | 0.3256 | 1.6350 | Adam | none |
| DenseNet-121 | 5.9 540 × 10-5 | 1.3 315 × 10-4 | 0.0547 | ce | 0.3256 | 1.6350 | Adam | none |
| EfficientNet-B0 | 1.0 645 × 10-3 | 5.4 870 × 10-5 | 0.1215 | focal | 0.2878 | 2.2738 | Adam | warmup_cosine |
| MobileNetV3-Large | 3.9 038 × 10-4 | 3.1 237 × 10-4 | 0.0701 | focal | 0.3531 | 2.4771 | AdamW | plateau |
Table 5. Selected backbone-specific augmentation and regularization hyperparameters.
| Model | MixUp | CutMix | Warmup ep. | Drop path | Grad clip | Head LR |
|---|---|---|---|---|---|---|
| EfficientNetV2-S | 0.1302 | 0.1759 | 1.0079 | 0.1053 | 1.0 | 6.3 680 × 10-4 |
| ConvNeXt-Tiny | 0.1302 | 0.1759 | 0.9835 | 0.1919 | 1.0 | 6.3 680 × 10-4 |
| ViT-B/16 | 0.0345 | 0.0572 | 0.0410 | 0.1919 | 1.0 | 1.6 317 × 10-4 |
| ResNet-50 | 0.0624 | 0.0709 | 0.3972 | 0.1863 | 0.5 | 2.7 253 × 10-4 |
| DenseNet-121 | 0.0624 | 0.0709 | 0.3972 | 0.1863 | 0.5 | 2.7 253 × 10-4 |
| EfficientNet-B0 | 0.0384 | 0.0876 | 1.2190 | 0.0300 | 1.0 | 1.8 068 × 10-3 |
| MobileNetV3-Large | 0.1302 | 0.1759 | 0.9835 | 0.1053 | 1.0 | 6.3 680 × 10-4 |
3.7 Weighted ensembling
In addition to single-model evaluation, the benchmark included a weighted probability ensemble. Ensemble weights were optimized by random search using 4,096 trials and the same precision-constrained F1 criterion used for threshold selection. The ensemble was evaluated only after all component backbones had completed their fold-specific model selection, fine-tuning, and calibration steps.
3.8 Evaluation metrics
Performance was summarized across the five folds using six complementary metrics. For a binary confusion matrix with true positives (TP), false positives (FP), true negatives (TN), and false negatives (FN):
The area under the receiver operating characteristic curve (AUC) was computed from the predicted probability outputs using the standard trapezoidal-rule implementation in scikit-learn (roc_auc_score) [34] and is not restated as a closed-form expression above. Each metric was computed independently within each of the five test folds, and the reported values represent the mean ± standard deviation across folds. To better characterize the operating behaviour, the raw confusion-matrix components (TP, FP, TN, FN) were also aggregated as mean ± standard deviation across folds.
3.9 Statistical analysis
To determine whether observed performance differences between models reflect genuine architectural effects rather than sampling variability, four complementary pairwise statistical tests were applied within each fold. McNemar’s test [35] assessed the significance of disagreements between two models’ hard-label predictions. A permutation test with 2,000 random permutations evaluated differences in F1-score. The Wilcoxon signed-rank test [36] was applied to per-sample predicted-probability differences. DeLong’s test [37] was used to compare AUC values. All p-values were corrected for multiple comparisons using the Bonferroni method across all pairwise model combinations within each fold. Because the statistical test suite included an additional ensemble variant not reported in the main results, the number of compared methods was nine in four folds and eight in one fold, yielding 36 and 28 pairwise comparisons respectively (adjusted or ). Results are reported in Section 4.2.
3.10 Implementation details
All experiments were implemented in Python 3.10 using PyTorch 2.1 and torchvision 0.16 for model definition, pretrained weight loading, and training. Pretrained ImageNet-1K weights were obtained from the torchvision model zoo using the default IMAGENET1K_V1 weight variants for each backbone. Hyperparameter optimization used Optuna 3.4 with the NSGA-II sampler. Temperature scaling, threshold selection, ensemble weight optimization, and Expected Calibration Error computation were performed using scikit-learn 1.3 and SciPy 1.11. Content-level near-duplicate auditing used 64-bit perceptual hashing via the ImageHash library. All training and primary inference were conducted on a single NVIDIA A100 (40 GB) GPU; the TTA ablation re-evaluation (Section 4.7) was conducted on an NVIDIA GeForce RTX 4060 Laptop GPU using the same saved checkpoints. Each backbone completed five-fold training, validation, and test evaluation in approximately 20–45 minutes depending on model size, corresponding to a total compute budget of approximately 15–25 GPU-hours including MOO trials (840 trial-runs at 6 epochs each) and ensemble optimization. The random seeds for each fold were fixed to 12345–12349 to ensure reproducibility; group-stratified fold assignment is deterministic given the file list ordering and seed. The complete run configuration, command log, and fold-wise outputs are supplied as supplementary material and are also available in the project repository.
3.11 Ethics statement
This study used publicly available, anonymized image data and did not require institutional ethical approval.
4 Results
4.1 Overall comparative performance
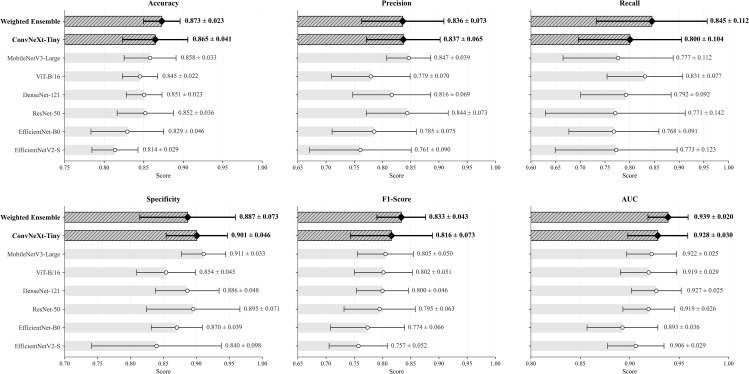
Table 6 and Fig 1 summarize fold-wise test performance for all evaluated models. All reported mean ± standard deviation values reflect inter-fold test-partition variability across the five cross-validation splits (not training stochasticity, since each fold uses a deterministic seed). As a reference, the majority-class baseline (always predicting “Others”) would yield an accuracy of 0.613 given the class distribution (339 mpox, 537 non-mpox), confirming that all evaluated models provide substantial improvement over the trivial baseline. The weighted ensemble achieved the best overall performance, with accuracy of 0.8729 ± 0.0232, precision of 0.8360 ± 0.0728, recall of 0.8449 ± 0.1119, F1-score of 0.8334 ± 0.0432, and AUC of 0.9388 ± 0.0203. For comparison, evaluating the same weighted ensemble at the fixed default threshold of 0.5 (without validation-based threshold selection) yielded a mean F1-score of 0.8255, indicating that the precision-constrained threshold strategy improved F1-score by +0.008 on average. Among the individual backbones, ConvNeXt-Tiny provided the strongest overall balance, achieving 0.8159 ± 0.0727 F1-score and 0.9284 ± 0.0303 AUC. ViT-B/16 yielded the highest mean recall among the individual backbones, whereas MobileNetV3-Large yielded the highest mean precision and specificity among the single models.
Table 6. Fold-wise test performance (mean ± standard deviation) across five cross-validation folds.
| Model | Acc. | Prec. | Rec. | Spec. | F1 | AUC |
|---|---|---|---|---|---|---|
| ConvNeXt-Tiny | 0.8647 ± 0.0412 | 0.8369 ± 0.0654 | 0.8005 ± 0.1043 | 0.9007 ± 0.0465 | 0.8159 ± 0.0727 | 0.9284 ± 0.0303 |
| DenseNet-121 | 0.8506 ± 0.0226 | 0.8164 ± 0.0692 | 0.7923 ± 0.0915 | 0.8863 ± 0.0482 | 0.8000 ± 0.0462 | 0.9270 ± 0.0251 |
| EfficientNet-B0 | 0.8293 ± 0.0460 | 0.7854 ± 0.0746 | 0.7680 ± 0.0911 | 0.8704 ± 0.0389 | 0.7736 ± 0.0656 | 0.8927 ± 0.0358 |
| EfficientNetV2-S | 0.8137 ± 0.0291 | 0.7610 ± 0.0900 | 0.7726 ± 0.1235 | 0.8395 ± 0.0984 | 0.7575 ± 0.0519 | 0.9061 ± 0.0286 |
| MobileNetV3-Large | 0.8581 ± 0.0329 | 0.8466 ± 0.0390 | 0.7765 ± 0.1115 | 0.9111 ± 0.0335 | 0.8053 ± 0.0498 | 0.9221 ± 0.0253 |
| ResNet-50 | 0.8521 ± 0.0357 | 0.8440 ± 0.0726 | 0.7708 ± 0.1416 | 0.8952 ± 0.0709 | 0.7950 ± 0.0632 | 0.9191 ± 0.0260 |
| ViT-B/16 | 0.8454 ± 0.0223 | 0.7794 ± 0.0696 | 0.8308 ± 0.0767 | 0.8540 ± 0.0446 | 0.8018 ± 0.0513 | 0.9192 ± 0.0286 |
| Weighted ensemble | 0.8729 ± 0.0232 | 0.8360 ± 0.0728 | 0.8449 ± 0.1119 | 0.8868 ± 0.0726 | 0.8334 ± 0.0432 | 0.9388 ± 0.0203 |
Fig 1. Cross-validation performance summary of the evaluated methods across five folds.

Each point represents the mean value across the five cross-validation folds, and the whiskers represent ±1 standard deviation around that mean. Methods are ordered by mean F1-score.
Relative to the strongest single backbone, the weighted ensemble improved mean F1-score by 0.0175 and mean AUC by 0.0104, indicating a modest but consistent gain rather than an abrupt change in operating behaviour. The rank ordering also shows that no single backbone is uniformly best across all metrics: ConvNeXt-Tiny performed best in overall single-model balance, ViT-B/16 favoured recall, and MobileNetV3-Large favoured specificity. Table 7 reports the normalized fold-specific weights selected by the ensemble optimizer. The learned weight distribution did not collapse onto a single dominant backbone; instead, the relative contribution of individual models varied across folds. Averaged across the five folds, the largest weights were assigned to ViT-B/16 (0.252), MobileNetV3-Large (0.208), and ResNet-50 (0.154), whereas ConvNeXt-Tiny, despite being the strongest individual model by mean F1-score, received a more modest average weight (0.106). This pattern suggests that the gain from ensembling arose from complementary error behaviour rather than from simply amplifying the predictions of the best single backbone. The absolute values in Table 6 should be interpreted in light of the stricter protocol used here. Because folds were defined on original images only, augmented images were excluded from reported test evaluation, and thresholds were selected and calibrated within each fold, the present estimates are intentionally more conservative than many single-split or augmentation-heavy reports in the literature. This conservatism is a strength of the benchmark, because it yields performance estimates that are more suitable as reproducible reference values than optimistic headline numbers derived from less restrictive designs.
Table 7. Normalized weights selected by random-search optimization for the weighted ensemble across the five cross-validation folds.
| Model | Fold 0 | Fold 1 | Fold 2 | Fold 3 | Fold 4 | Mean |
|---|---|---|---|---|---|---|
| ConvNeXt-Tiny | 0.07 | 0.14 | 0.10 | 0.21 | 0.01 | 0.106 |
| DenseNet-121 | 0.03 | 0.03 | 0.15 | 0.03 | 0.11 | 0.070 |
| EfficientNet-B0 | 0.11 | 0.13 | 0.23 | 0.09 | 0.09 | 0.130 |
| EfficientNetV2-S | 0.09 | 0.08 | 0.21 | 0.02 | 0.00 | 0.080 |
| MobileNetV3-Large | 0.62 | 0.09 | 0.04 | 0.11 | 0.18 | 0.208 |
| ResNet-50 | 0.05 | 0.05 | 0.04 | 0.16 | 0.47 | 0.154 |
| ViT-B/16 | 0.03 | 0.48 | 0.23 | 0.38 | 0.14 | 0.252 |
4.2 Statistical significance of pairwise differences
To assess whether the observed performance differences are attributable to model architecture rather than sampling variability, the four statistical tests described in Section 3.9 were applied to every pairwise model comparison within each fold.
The central finding is that the improvement of the weighted ensemble over the strongest single backbone (ConvNeXt-Tiny) did not reach statistical significance after correction in any individual fold (permutation F1 p-values ranged from 0.005 to 0.589; DeLong AUC p-values ranged from 0.044 to 0.916). This result is consistent with the modest magnitude of the observed gains (F1 = 0.0175, AUC = 0.0104) and the limited per-fold test set size (), and it confirms that the ensemble advantage reported in Table 6 should be interpreted as a consistent directional trend rather than a statistically confirmed improvement.
By contrast, several backbone-level comparisons did reach Bonferroni-corrected significance in at least one fold, confirming that the benchmark retains sufficient statistical power to detect genuine architectural differences when they are large enough. For example, ConvNeXt-Tiny significantly outperformed EfficientNetV2-S in Fold 1 on both McNemar (p < 0.001) and permutation F1 (p < 0.001), and ViT-B/16 significantly outperformed EfficientNet-B0 in Fold 0 on permutation F1 (p < 0.001). The fact that significance was fold-dependent rather than universal further underscores the dataset-driven variability discussed in Section 5 and reinforces the argument that stable claims require larger and more diverse evaluation cohorts.
4.3 Model complexity
Table 8 reports the total number of trainable parameters for each backbone after replacing the original classification head with a binary output layer. All backbones used input resolution. Parameter counts range from 3.0 M for MobileNetV3-Large to 86.6 M for ViT-B/16, spanning roughly a 29× difference. Despite having the fewest parameters, MobileNetV3-Large achieved the highest single-model specificity (0.9111) and the second-highest F1-score (0.8053), confirming that a lightweight architecture can remain competitive under the present benchmark conditions. Conversely, ViT-B/16, the largest model, yielded the highest single-model recall (0.8308) but not the highest F1-score, indicating that additional model capacity does not uniformly translate into better overall performance when the training set is small. The weighted ensemble aggregates the outputs of all seven backbones and therefore carries the combined parameter budget (approximately 172.1 M) at inference time, which is the principal cost of the ensemble strategy.
Table 8. Model complexity of the evaluated backbones (binary classification head, input). GFLOPs were computed using the torchprofile library.
| Model | Parameters (M) | GFLOPs |
|---|---|---|
| MobileNetV3-Large | 3.0 | 0.23 |
| EfficientNet-B0 | 4.0 | 0.40 |
| DenseNet-121 | 7.0 | 2.87 |
| ResNet-50 | 23.5 | 4.12 |
| ConvNeXt-Tiny | 27.8 | 4.47 |
| EfficientNetV2-S | 20.2 | 8.37 |
| ViT-B/16 | 86.6 | 17.56 |
| Weighted ensemble (all 7) | ∼172.1 | ∼38.0 |
4.4 Error profile
Table 9 reports the mean confusion-matrix components. The weighted ensemble yielded the highest mean number of true positives (57.8 ± 14.9) and the lowest mean number of false negatives (10.0 ± 6.6), consistent with its leading recall and F1-score. ConvNeXt-Tiny retained a slightly lower false-positive burden (10.8 ± 5.4) than the weighted ensemble while preserving strong AUC. MobileNetV3-Large achieved the lowest mean false-positive count among the single models (9.6 ± 3.8), which aligns with its specificity advantage. These patterns confirm that the benchmark contains clinically relevant operating trade-offs rather than a universally dominant single backbone. Together with Fig 1, the table shows that improvements in one operating characteristic were typically achieved through balanced changes in others rather than through uniformly better performance across every metric.
Table 9. Mean confusion-matrix components (mean ± standard deviation) across five folds.
| Model | TP | FP | TN | FN |
|---|---|---|---|---|
| ConvNeXt-Tiny | 55.0 ± 15.4 | 10.8 ± 5.4 | 96.6 ± 4.5 | 12.8 ± 5.3 |
| DenseNet-121 | 54.0 ± 12.9 | 12.4 ± 5.6 | 95.0 ± 2.5 | 13.8 ± 6.1 |
| EfficientNet-B0 | 51.8 ± 9.9 | 14.0 ± 4.4 | 93.4 ± 5.0 | 16.0 ± 8.3 |
| EfficientNetV2-S | 52.4 ± 11.6 | 17.2 ± 10.7 | 90.2 ± 12.2 | 15.4 ± 8.4 |
| MobileNetV3-Large | 52.2 ± 9.3 | 9.6 ± 3.8 | 97.8 ± 5.4 | 15.6 ± 9.4 |
| ResNet-50 | 53.2 ± 16.6 | 11.4 ± 7.8 | 96.0 ± 7.0 | 14.6 ± 6.9 |
| ViT-B/16 | 56.6 ± 12.7 | 15.8 ± 5.4 | 91.6 ± 4.5 | 11.2 ± 4.8 |
| Weighted ensemble | 57.8 ± 14.9 | 12.4 ± 8.4 | 95.0 ± 5.5 | 10.0 ± 6.6 |
4.5 Calibration quality
To assess the effect of temperature scaling (Section 3.8) on prediction calibration, Table 10 reports the Expected Calibration Error (ECE, 15 equal-width bins) on the held-out test partition of each fold, both before and after temperature scaling. Pre-calibration probabilities were recovered analytically by inverting the per-model temperature parameter (T) applied during the original run. Across all five folds, temperature scaling reduced the mean ECE for ViT-B/16 (0.0939 → 0.0815) and for the weighted ensemble (0.1138 → 0.1041), consistent with the known tendency of vision transformers and heterogeneous ensembles to benefit from post hoc calibration. For ConvNeXt-Tiny (0.0768 → 0.0849) and MobileNetV3-Large (0.1034 → 0.1071), the mean ECE increased marginally after scaling; inspection of the per-fold temperatures reveals that these models already had in several folds, indicating mild underconfidence that temperature scaling slightly amplified. The overall post-calibration ECE range of 0.05–0.15 indicates moderate calibration quality that is informative for threshold tuning, consistent with the small per-fold test sizes (). Importantly, temperature scaling preserves the monotonic ranking of predicted probabilities even in the cases where bin-wise ECE increases slightly, so the downstream threshold selection step (Section 4.6) still benefits from the scaled outputs.
Table 10. Expected Calibration Error (ECE, 15 equal-width bins) before and after temperature scaling, per fold, for the weighted ensemble and the three most informative single backbones.
| Fold 0 | Fold 1 | Fold 2 | Fold 3 | Fold 4 | Mean | |||||||
|---|---|---|---|---|---|---|---|---|---|---|---|---|
| Model | Pre | Post | Pre | Post | Pre | Post | Pre | Post | Pre | Post | Pre | Post |
| ConvNeXt-Tiny | 0.067 | 0.067 | 0.075 | 0.108 | 0.093 | 0.080 | 0.062 | 0.058 | 0.088 | 0.113 | 0.077 | 0.085 |
| ViT-B/16 | 0.070 | 0.053 | 0.103 | 0.073 | 0.055 | 0.057 | 0.131 | 0.117 | 0.110 | 0.107 | 0.094 | 0.081 |
| MobileNetV3-Large | 0.133 | 0.124 | 0.105 | 0.149 | 0.092 | 0.088 | 0.090 | 0.087 | 0.097 | 0.087 | 0.103 | 0.107 |
| Weighted ensemble | 0.126 | 0.118 | 0.124 | 0.149 | 0.108 | 0.077 | 0.111 | 0.109 | 0.100 | 0.067 | 0.114 | 0.104 |
4.6 Threshold selection and operating-point verification
Table 11 reports the decision threshold selected on the validation subset of each fold using the f1_at_precision strategy (precision target , minimum recall ). For the weighted ensemble, the selected thresholds ranged from 0.323 to 0.485 across folds. The precision target was met on the test partition in 3 of 5 folds (Folds 0, 2, and 4); in Folds 1 and 3 the test precision fell slightly below 0.80 (0.741 and 0.776 respectively), reflecting the difficulty of generalizing a validation-tuned threshold to a small test partition. The recall floor of 0.85 was met in 3 of 5 folds (Folds 1, 2, and 3); the shortfall in Folds 0 and 4 is attributable to the small per-fold positive count (). These values allow readers to reproduce the exact operating point used for each reported confusion matrix and to assess the stability of threshold transfer from validation to test.
Table 11. Validation-selected decision thresholds and corresponding test-set precision and recall for the weighted ensemble, per fold.
| Fold | Threshold | Test Prec. | Test Rec. | Prec.≥0.80? | Rec.≥0.85? |
|---|---|---|---|---|---|
| 0 | 0.389 | 0.8873 | 0.7778 | ✓ | × |
| 1 | 0.323 | 0.7407 | 0.9375 | × | ✓ |
| 2 | 0.365 | 0.9016 | 0.8730 | ✓ | ✓ |
| 3 | 0.369 | 0.7755 | 0.9500 | × | ✓ |
| 4 | 0.485 | 0.8750 | 0.6863 | ✓ | × |
4.7 Test-time augmentation ablation
To quantify the contribution of 16-fold test-time augmentation (TTA), all models were re-evaluated on the same five test folds with TTA disabled (single-crop inference) using the same saved checkpoints and identical data splits. Table 12 reports the resulting mean F1-score and AUC for the weighted ensemble and the three most informative single backbones. Enabling TTA improved mean F1-score by +0.009 and mean AUC by +0.002 for the weighted ensemble, confirming that TTA provides a consistent but modest gain under the present benchmark conditions. The improvement was largest for MobileNetV3-Large (F1 = +0.026), consistent with the observation that its squeeze-and-excitation blocks benefit from averaging over spatially diverse inputs. ViT-B/16 showed a marginal F1 decrease with TTA (−0.004) despite a slight AUC improvement (+0.002), meaning that the primary ViT-B/16 F1-score reported in Table 6 is 0.0035 lower than it would be under single-crop inference; this suggests that multi-crop averaging occasionally shifts the optimal operating point without improving discrimination for models with global receptive fields. Overall, TTA contributes a small but consistent benefit at the ensemble level, and the moderate absolute improvement confirms that the reported performance is not critically dependent on the TTA protocol.
Table 12. Effect of 16-fold test-time augmentation (TTA) on mean F1-score and AUC across five folds.
| TTA off | TTA on (16-fold) | |||
|---|---|---|---|---|
| Model | F1 | AUC | F1 | AUC |
| ConvNeXt-Tiny | 0.8101 | 0.9261 | 0.8159 | 0.9284 |
| ViT-B/16 | 0.8053 | 0.9171 | 0.8018 | 0.9192 |
| MobileNetV3-Large | 0.7795 | 0.9182 | 0.8053 | 0.9221 |
| Weighted ensemble | 0.8246 | 0.9365 | 0.8334 | 0.9388 |
4.8 Fold-specific operating plots
All numerical results reported in this study are based on five-fold cross-validation, not single runs. Tables 6 and 9 report the mean ± standard deviation across the five folds, and Fig 1 displays these fold-level statistics as dot-and-whisker plots in which each point represents the mean and each whisker spans ±1 standard deviation. This visualization confirms that the performance differences between the closest rivals (e.g., the weighted ensemble versus ConvNeXt-Tiny) are accompanied by overlapping standard deviation bands in several metrics, which reflects the genuine difficulty of the task rather than a single-run artefact. The fold-specific confusion matrices, ROC curves, and precision–recall curves shown below are drawn from individual representative folds (Fold 2, Fold 3, and Fold 4 respectively) to illustrate the operating behaviour on a single split; the corresponding aggregate statistics with standard deviations are provided in the tables and in Fig 1.
To complement the aggregate metrics, Figs 2–4 present fold-specific confusion matrices, receiver operating characteristic (ROC) curves, and precision–recall (PR) curves for the four most informative methods: the weighted ensemble, ConvNeXt-Tiny, ViT-B/16, and MobileNetV3-Large. These methods were selected because they respectively represent the best overall performance, the strongest single-model balance, the strongest recall-oriented single model, and the strongest specificity-oriented single model in Table 6. To avoid overemphasizing any single split, a different representative fold is used for each plot category: Fold 2 for confusion matrices, Fold 3 for ROC curves, and Fold 4 for precision–recall curves. Within each category, all four methods share the same fold so that the visual comparison remains like-for-like. Fig 2 makes the operating trade-offs in Table 9 visually explicit: the weighted ensemble shows the most favorable true-positive/false-negative balance, ConvNeXt-Tiny remains the most balanced single model, ViT-B/16 emphasizes sensitivity, and MobileNetV3-Large limits false positives more aggressively. Fig 3 shows the corresponding ranking in ROC space, where the weighted ensemble provides the strongest overall discrimination and ConvNeXt-Tiny remains the strongest single-model trajectory. Fig 4 provides the complementary precision–recall view, in which the weighted ensemble retains the strongest overall balance while ViT-B/16 and MobileNetV3-Large illustrate recall-oriented and specificity-oriented alternatives.
Fig 2. Fold-specific confusion matrices for the weighted ensemble (top-left), ConvNeXt-Tiny (top-right), ViT-B/16 (bottom-left), and MobileNetV3-Large (bottom-right) using Fold 2.

These panels visualize the true-positive, false-positive, true-negative, and false-negative trade-offs summarized numerically in Table 9.
Fig 4. Fold-specific precision–recall curves for the weighted ensemble (top-left), ConvNeXt-Tiny (top-right), ViT-B/16 (bottom-left), and MobileNetV3-Large (bottom-right) using Fold 4.

These panels complement the ROC view by emphasizing precision–recall trade-offs under the same benchmark conditions.
Fig 3. Fold-specific ROC curves for the weighted ensemble (top-left), ConvNeXt-Tiny (top-right), ViT-B/16 (bottom-left), and MobileNetV3-Large (bottom-right) using Fold 3.

These panels provide the threshold-varying discrimination view corresponding to the mean AUC values reported in Table 6.
5 Discussion
The benchmark demonstrates that strong binary mpox classification can be obtained from a unified curated lesion-image dataset, but it also shows that performance remains meaningfully imperfect under a stricter protocol built around group-aware splitting, original-only test evaluation, calibrated thresholds, and fold-wise reporting. This distinction matters because public lesion-image datasets often contain repeated variants, heterogeneous acquisition conditions, and mixed source provenance, all of which can inflate apparent performance if evaluation design is not carefully controlled [9]. In this sense, the comparatively moderate results reported here should not be read as a weakness relative to earlier, higher literature figures; rather, they reflect an intentional shift toward a more conservative and auditable evaluation design.
The relative ranking of the evaluated methods is consistent with this interpretation. The weighted ensemble produced the best overall F1-score and AUC, suggesting that combining calibrated model outputs is beneficial when source heterogeneity and class overlap remain present. However, the gain over the best single backbone was moderate rather than dramatic, and fold-level statistical testing (Section 4.2) confirmed that this difference did not reach significance after Bonferroni correction, which indicates that the ensemble improves robustness without removing the underlying difficulty of the task. Among the individual backbones, ConvNeXt-Tiny provided the best overall balance, ViT-B/16 was more recall-oriented, and MobileNetV3-Large was more specificity-oriented. This pattern is practically useful because the preferred operating point depends on the intended deployment context. A screening-oriented workflow may prioritize recall and low false negatives, whereas a triage setting seeking to limit unnecessary referrals may place more emphasis on specificity.
It is important to note that the fold-level variability in several metrics is substantial and should be interpreted as an informative constraint rather than a limitation of the modelling alone. For instance, the weighted ensemble recall standard deviation of 0.1119 implies that individual-fold recall values plausibly range from approximately 0.73 to 0.96, meaning that in the least favourable fold roughly one in four mpox cases would be missed. Similarly, ResNet-50 exhibited a recall standard deviation of 0.1416, the highest among all evaluated models. These fluctuations are primarily attributable to the small per-fold test sets (approximately 68 positive and 107 negative images per fold) and to source-level heterogeneity in the underlying public data rather than to architectural deficiency. The fold-wise ensemble weight distribution in Table 7 corroborates this interpretation: the dominant backbone shifts across folds (for example, MobileNetV3-Large receives weight 0.62 in Fold 0 but only 0.04 in Fold 2), indicating that the difficulty of each test partition varies enough to alter the optimal model mixture. These patterns define a performance plateau at which further architectural tuning is unlikely to yield stable gains without larger, more diverse, and externally validated image collections.
Several architectural and data-level factors may explain the observed performance patterns. First, ConvNeXt-Tiny achieved the strongest single-model F1-score, consistent with the hypothesis that its hierarchical convolutional design with depthwise convolutions and large kernels captures both local texture cues (e.g., vesicle boundaries and pustule morphology) and medium-range spatial context, which are likely among the primary discriminative features in lesion imagery. Second, ViT-B/16 exhibited the highest recall, plausibly reflecting its global self-attention mechanism that distributes receptive-field coverage uniformly across the image from the first layer, making it less likely to miss atypical or peripherally located lesions; however, this same property may increase false-positive susceptibility when background skin regions share colour statistics with early-stage lesions, which would account for its comparatively lower precision. Third, MobileNetV3-Large achieved the highest specificity despite having the fewest parameters (3.0 M), which is consistent with the channel-wise recalibration performed by its squeeze-and-excitation blocks that may effectively suppress non-lesion texture responses, yielding conservative positive predictions at the cost of lower recall. Fourth, the weighted ensemble outperformed all single backbones, which is consistent with the expectation that architecturally diverse error profiles (convolutional locality bias in ConvNeXt-Tiny and MobileNetV3, global attention bias in ViT-B/16, and residual gradient flow differences in ResNet-50 and DenseNet-121) are sufficiently complementary that a learned convex combination reduces the variance of the final prediction without requiring additional training data. Finally, the moderate absolute performance level (F1 ≈ 0.83 rather than >0.95) is best explained by the data characteristics themselves: the unified benchmark merges two independently collected sources with different acquisition devices, lighting conditions, and racial diversity profiles, and the strict exclusion of augmented images from test evaluation removes the artificial variance reduction that augmentation-based protocols provide. Under these conditions, the performance ceiling is constrained by inter-source heterogeneity and the relatively small number of original mpox images (339), rather than by any single modelling choice.
The present results fit within the broader mpox literature but should not be reduced to a leaderboard comparison. As summarized in Table 1, published peer-reviewed studies report accuracies ranging from approximately 87% under conservative protocols [5,13] to above 99% under augmentation-heavy or validation-only designs [17,19,21]. Three factors account for most of this spread. First, class granularity varies: binary mpox-versus-others settings tend to yield higher headline figures than multiclass differential-diagnosis settings [11,14]. Second, augmentation intensity differs markedly; studies that report test metrics on augmented data consistently outperform those that restrict evaluation to original images [11,12]. Third, evaluation design ranges from single predefined splits with no leakage analysis [6,17] to cross-validated but non-grouped schemes [14], and the ranking of backbones has been shown to change between datasets [7]. The present benchmark’s accuracy of 0.8729 and F1-score of 0.8334 under grouped original-only evaluation therefore falls at the conservative end of the published range, which is consistent with the deliberately strict protocol rather than indicative of modelling weakness. In this context, the more informative comparison is not with the absolute peak figures in the literature but with the degree to which the present design controls the confounds that inflate those figures.
Several limitations should be acknowledged. First, the unified benchmark relies on public lesion images rather than prospectively collected clinical data; external validation on an independent clinical cohort remains essential before the reported performance can be interpreted as deployment-ready. To mitigate this limitation, the study incorporates a rigorous suite of internal robustness analyses that collectively provide stronger evidence of methodological soundness than is typical of single-dataset benchmarks: (i) content-level near-duplicate auditing via perceptual hashing confirmed zero cross-fold leaks across 876 images (Section 3.3); (ii) pre- and post-calibration ECE was quantified for every model in every fold, revealing both the benefits and limits of temperature scaling (Section 4.5); (iii) per-fold decision thresholds were reported with explicit verification of whether precision and recall targets were met on the test partition (Section 4.6); (iv) a TTA ablation using the same saved checkpoints and identical data splits demonstrated that the reported results are not critically dependent on the test-time augmentation protocol (Section 4.7); and (v) four complementary statistical tests with Bonferroni correction were applied to all pairwise model comparisons within each fold (Section 4.2). While these analyses do not substitute for external validation, they ensure that the reported performance estimates are internally consistent, auditable, and not inflated by methodological artefacts.
Second, although the perceptual-hash audit confirmed that no content-level near-duplicate leaked across folds, these checks cannot detect semantically similar images that differ at the pixel level (e.g., the same lesion photographed from slightly different angles); true patient-level identity control would require metadata that the public MSLD sources do not provide. Third, the benchmark is binary, whereas real clinical workflows often require richer differential diagnosis across multiple dermatological conditions and acquisition settings. Although MSLD v2.0 was developed with explicit attention to racial diversity, the present benchmark does not include image-level demographic or skin-tone annotations; therefore, fairness across skin tones cannot be directly assessed and remains an important direction for future work [22].
These limitations are consistent with the critique summarized by Hossain et al., who highlighted dataset quality, weak generalizability, lesion variability, image noise, and inconsistent benchmarking as open problems in this field [9]. The present benchmark addresses part of that problem by specifying how data were selected, grouped, mixed, thresholded, calibrated, and reported, and by making the resulting estimates deliberately conservative. Future studies should build on this by introducing external validation cohorts, explicit patient-level identifiers, richer clinical metadata, and prospective evaluation in realistic acquisition settings.
6 Conclusion
This study presented a leakage-aware benchmark for binary mpox skin-image classification using a unified curated dataset assembled from MSLD v1.0 and MSLD v2.0. Seven pretrained backbones and a weighted ensemble were compared under a shared protocol defined by group-stratified 5-fold cross-validation, original-only test evaluation, controlled use of augmented images during training, original-only fine-tuning, validation-based threshold selection, and temperature scaling.
The weighted ensemble achieved the best overall performance, with mean accuracy of 0.8729 ± 0.0232, precision of 0.8360 ± 0.0728, recall of 0.8449 ± 0.1119, specificity of 0.8868 ± 0.0726, F1-score of 0.8334 ± 0.0432, and AUC of 0.9388 ± 0.0203 across the five folds. Among the individual backbones, ConvNeXt-Tiny provided the strongest overall single-model performance (F1-score 0.8159 ± 0.0727). The results show that weighted ensembling improves robustness under a carefully controlled evaluation setting, but the substantial fold-level variability, particularly in recall (SD = 0.1119 for the ensemble), confirms that performance remains dataset-dependent and that the current public data do not yet support stable, deployment-grade classification.
The main contribution of this work is therefore methodological: a transparent benchmark in which dataset construction, group handling, training policy, threshold selection, calibration, and evaluation protocol are documented in sufficient detail to support meaningful interpretation. In relation to the existing mpox imaging literature, the study contributes a stricter and more reproducible reference design rather than a new architecture, which is why its value lies in the credibility of the benchmark rather than in a single peak accuracy claim. Future work should extend this line of research through externally validated datasets, explicit patient-level deduplication, richer multiclass differential diagnosis, and prospective real-world assessment.
Data Availability
The MSLD v1.0 and MSLD v2.0 source datasets used in the unified benchmark are publicly available and are cited in the reference list [7,22]. The reproducibility materials underlying the reported tables and figures, including dataset curation materials, run configuration, command log, fold-wise summary outputs, and figure-generation code, are available at https://github.com/ibrahimsadek/mpox_monkey.
Funding Statement
This work was supported in part by Kingdom University, Bahrain, under Grant KU-SRU-2026-13. No additional external funding was received for this study.
References
- 1.Bryant AE, Shulman ST. Mpox: emergence following smallpox eradication, ongoing outbreaks and strategies for prevention. Curr Opin Infect Dis. 2025;38(3):222–7. doi: 10.1097/QCO.0000000000001100 [DOI] [PubMed] [Google Scholar]
- 2.Altindis M, Puca E, Shapo L. Diagnosis of monkeypox virus – An overview. Travel Med Infect Dis. 2022;50:102459. doi: 10.1016/j.tmaid.2022.102459 [DOI] [PMC free article] [PubMed] [Google Scholar]
- 3.Khan A, Aziz S, Fayaz M, Shah B, Algarni F. A CNN-LSTM model for sentiment analysis on monkeypox tweets. New Generation Computing. 2023;42:89–107. doi: 10.1007/s00354-023-00227-0 [DOI] [Google Scholar]
- 4.Chadaga K, Prabhu S, Sampathila N, Nireshwalya S, Katta SS, Tan RS, et al. Application of Artificial Intelligence Techniques for Monkeypox: A Systematic Review. Diagnostics. 2023;13(5):824. doi: 10.3390/diagnostics13050824 [DOI] [PMC free article] [PubMed] [Google Scholar]
- 5.Sitaula C, Shahi TB. Monkeypox Virus Detection Using Pre-trained Deep Learning-based Approaches. J Med Syst. 2022;46(11):78. doi: 10.1007/s10916-022-01868-2 [DOI] [PMC free article] [PubMed] [Google Scholar]
- 6.Sahin VH, Oztel I, Yolcu Oztel G. Human Monkeypox Classification from Skin Lesion Images with Deep Pre-trained Network using Mobile Application. J Med Syst. 2022;46(11):79. doi: 10.1007/s10916-022-01863-7 [DOI] [PMC free article] [PubMed] [Google Scholar]
- 7.Almufareh MF, Tehsin S, Humayun M, Kausar S. A Transfer Learning Approach for Clinical Detection Support of Monkeypox Skin Lesions. Diagnostics (Basel). 2023;13(8):1503. doi: 10.3390/diagnostics13081503 [DOI] [PMC free article] [PubMed] [Google Scholar]
- 8.Muñoz-Saavedra L, Escobar-Linero E, Civit-Masot J, Luna-Perejón F, Civit A, Domínguez-Morales M. A Robust Ensemble of Convolutional Neural Networks for the Detection of Monkeypox Disease from Skin Images. Sensors (Basel). 2023;23(16):7134. doi: 10.3390/s23167134 [DOI] [PMC free article] [PubMed] [Google Scholar]
- 9.Hossain MS, Ahmed M, Rahman MS. From survey to solution: A deep learning framework for reliable monkeypox diagnosis using skin images. Array. 2025;28:100554. doi: 10.1016/j.array.2025.100554 [DOI] [Google Scholar]
- 10.Vega C, Schneider R, Satagopam V. Analysis: Flawed Datasets of Monkeypox Skin Images. J Med Syst. 2023;47(1):37. doi: 10.1007/s10916-023-01928-1 [DOI] [PMC free article] [PubMed] [Google Scholar]
- 11.Bala D, Hossain MS, Hossain MA, Abdullah MI, Rahman MM, Manavalan B, et al. MonkeyNet: A robust deep convolutional neural network for monkeypox disease detection and classification. Neural Netw. 2023;161:757–75. doi: 10.1016/j.neunet.2023.02.022 [DOI] [PMC free article] [PubMed] [Google Scholar]
- 12.Altun M, Gürüler H, Özkaraca O, Khan F, Khan J, Lee Y. Monkeypox Detection Using CNN with Transfer Learning. Sensors (Basel). 2023;23(4):1783. doi: 10.3390/s23041783 [DOI] [PMC free article] [PubMed] [Google Scholar]
- 13.Uysal F. Detection of Monkeypox Disease from Human Skin Images with a Hybrid Deep Learning Model. Diagnostics (Basel). 2023;13(10):1772. doi: 10.3390/diagnostics13101772 [DOI] [PMC free article] [PubMed] [Google Scholar]
- 14.Sorayaie Azar A, Naemi A, Babaei Rikan S, Bagherzadeh Mohasefi J, Pirnejad H, Wiil UK. Monkeypox detection using deep neural networks. BMC Infect Dis. 2023;23(1):438. doi: 10.1186/s12879-023-08408-4 [DOI] [PMC free article] [PubMed] [Google Scholar]
- 15.Thieme AH, Zheng Y, Machiraju G, Sadee C, Mittermaier M, Gertler M, et al. A deep-learning algorithm to classify skin lesions from mpox virus infection. Nat Med. 2023;29(3):738–47. doi: 10.1038/s41591-023-02225-7 [DOI] [PMC free article] [PubMed] [Google Scholar]
- 16.Nayak T, Chadaga K, Sampathila N, Mayrose H, Muralidhar Bairy G, Prabhu S. Detection of monkeypox from skin lesion images using deep learning networks and explainable artificial intelligence. Applied Mathematics in Science and Engineering. 2023;31(1):2225698. doi: 10.1080/27690911.2023.2225698 [DOI] [Google Scholar]
- 17.Nayak T, Chadaga K, Sampathila N, Mayrose H, Gokulkrishnan N, Bairy MG, et al. Deep learning based detection of monkeypox virus using skin lesion images. Medicine in Novel Technology and Devices. 2023;18:100243. doi: 10.1016/j.medntd.2023.100243 [DOI] [PMC free article] [PubMed] [Google Scholar]
- 18.Pramanik R, Banerjee B, Efimenko G, Kaplun D, Sarkar R. Monkeypox detection from skin lesion images using an amalgamation of CNN models aided with Beta function-based normalization scheme. PLoS One. 2023;18(4):e0281815. doi: 10.1371/journal.pone.0281815 [DOI] [PMC free article] [PubMed] [Google Scholar]
- 19.Bamaqa A, Bahgat WM, AbdulAzeem Y, Balaha HM, Badawy M, Elhosseini MA. Early detection of monkeypox: Analysis and optimization of pretrained deep learning models using the Sparrow Search Algorithm. Results in Engineering. 2024;24:102985. doi: 10.1016/j.rineng.2024.102985 [DOI] [Google Scholar]
- 20.Aslam S, Khan MU, Arif S, Khosa SA. Monkeypox recognition and prediction from visuals using deep transfer learning-based neural networks. Multimedia Tools and Applications. 2024;83:67543–68. doi: 10.1007/s11042-024-18437-z [DOI] [Google Scholar]
- 21.Elhadidy MS, Elgohr AT, Mousa A, Safwat A, Abdelfatah RI, Kasem HM. Benchmarking Pre-trained CNNs and Vision Transformers for Mpox-related Dermatological Image Classification on MSLD v2.0. Results in Engineering. 2025;28:108071. doi: 10.1016/j.rineng.2025.108071 [DOI] [Google Scholar]
- 22.Ali SN, Ahmed MdT, Jahan T, Paul J, Sakeef Sani SM, Noor N, et al. A web-based mpox skin lesion detection system using state-of-the-art deep learning models considering racial diversity. Biomedical Signal Processing and Control. 2024;98:106742. doi: 10.1016/j.bspc.2024.106742 [DOI] [Google Scholar]
- 23.Shorten C, Khoshgoftaar TM. A survey on Image Data Augmentation for Deep Learning. J Big Data. 2019;6(1). doi: 10.1186/s40537-019-0197-0 [DOI] [PMC free article] [PubMed] [Google Scholar]
- 24.Zauner C. Implementation and Benchmarking of Perceptual Image Hash Functions [Diploma Thesis]. Upper Austria University of Applied Sciences: Hagenberg Campus. 2010. [Google Scholar]
- 25.Tan M, Le QV. In: Proceedings of the 38th International Conference on Machine Learning (ICML), 2021. 10096–106. 10.48550/arXiv.2104.00298 [DOI]
- 26.Liu Z, Mao H, Wu C-Y, Feichtenhofer C, Darrell T, Xie S. A ConvNet for the 2020s. In: 2022 IEEE/CVF Conference on Computer Vision and Pattern Recognition (CVPR), 2022. 11966–76. 10.1109/cvpr52688.2022.01167 [DOI]
- 27.Dosovitskiy A, Beyer L, Kolesnikov A, Weissenborn D, Zhai X, Unterthiner T, et al. An Image is Worth 16×16 Words: Transformers for Image Recognition at Scale. In: 2021. 10.48550/arXiv.2010.11929 [DOI]
- 28.He K, Zhang X, Ren S, Sun J. Deep Residual Learning for Image Recognition. In: 2016 IEEE Conference on Computer Vision and Pattern Recognition (CVPR), 2016. 770–8. 10.1109/cvpr.2016.90 [DOI]
- 29.Huang G, Liu Z, Van Der Maaten L, Weinberger KQ. Densely Connected Convolutional Networks. In: 2017 IEEE Conference on Computer Vision and Pattern Recognition (CVPR), 2017. 2261–9. 10.1109/cvpr.2017.243 [DOI]
- 30.Tan M, Le QV. In: Proceedings of the 36th International Conference on Machine Learning (ICML), 2019. 6105–14. 10.48550/arXiv.1905.11946 [DOI]
- 31.Howard A, Sandler M, Chen B, Wang W, Chen L-C, Tan M, et al. Searching for MobileNetV3. In: 2019 IEEE/CVF International Conference on Computer Vision (ICCV), 2019. 1314–24. 10.1109/iccv.2019.00140 [DOI]
- 32.Guo C, Pleiss G, Sun Y, Weinberger KQ. In: Proceedings of the 34th International Conference on Machine Learning (ICML), 2017. 1321–30. 10.48550/arXiv.1706.04599 [DOI]
- 33.Akiba T, Sano S, Yanase T, Ohta T, Koyama M. In: Proceedings of the 25th ACM SIGKDD International Conference on Knowledge Discovery and Data Mining (KDD), 2019. 2623–31. 10.1145/3292500.3330701 [DOI]
- 34.Fawcett T. An introduction to ROC analysis. Pattern Recognition Letters. 2006;27(8):861–74. doi: 10.1016/j.patrec.2005.10.010 [DOI] [Google Scholar]
- 35.McNemar Q. Note on the sampling error of the difference between correlated proportions or percentages. Psychometrika. 1947;12(2):153–7. doi: 10.1007/BF02295996 [DOI] [PubMed] [Google Scholar]
- 36.Wilcoxon F. Individual comparisons by ranking methods. Biometrics Bulletin. 1945;1(6):80–3. doi: 10.2307/3001968 [DOI] [Google Scholar]
- 37.DeLong ER, DeLong DM, Clarke-Pearson DL. Comparing the areas under two or more correlated receiver operating characteristic curves: a nonparametric approach. Biometrics. 1988;44(3):837–45. doi: 10.2307/2531595 [DOI] [PubMed] [Google Scholar]
11 Mar 2026
–>PONE-D-25-66974–>–>AI-Driven Diagnosis of Monkeypox using Deep Learning Models–>–>PLOS One
Dear Dr. Sadek,
Thank you for submitting your manuscript to PLOS ONE. After careful consideration, we feel that it has merit but does not fully meet PLOS ONE’s publication criteria as it currently stands. Therefore, we invite you to submit a revised version of the manuscript that addresses the points raised during the review process.
Please submit your revised manuscript by Apr 25 2026 11:59PM. If you will need more time than this to complete your revisions, please reply to this message or contact the journal office at . When you’re ready to submit your revision, log on to https://www.editorialmanager.com/pone/ and select the ‘Submissions Needing Revision’ folder to locate your manuscript file.
Please include the following items when submitting your revised manuscript:–>
-
A letter that responds to each point raised by the academic editor and reviewer(s). You should upload this letter as a separate file labeled ‘Response to Reviewers’.
-
A marked-up copy of your manuscript that highlights changes made to the original version. You should upload this as a separate file labeled ‘Revised Manuscript with Track Changes’.
-
An unmarked version of your revised paper without tracked changes. You should upload this as a separate file labeled ‘Manuscript’.
If you would like to make changes to your financial disclosure, please include your updated statement in your cover letter. Guidelines for resubmitting your figure files are available below the reviewer comments at the end of this letter.
If applicable, we recommend that you deposit your laboratory protocols in protocols.io to enhance the reproducibility of your results. Protocols.io assigns your protocol its own identifier (DOI) so that it can be cited independently in the future. For instructions see: https://journals.plos.org/plosone/s/submission-guidelines#loc-laboratory-protocols. Additionally, PLOS ONE offers an option for publishing peer-reviewed Lab Protocol articles, which describe protocols hosted on protocols.io. Read more information on sharing protocols at https://plos.org/protocols?utm_medium=editorial-email&utm_source=authorletters&utm_campaign=protocols.
We look forward to receiving your revised manuscript.
Kind regards,
Morufu Olalekan Raimi, Ph.D
Academic Editor
PLOS One
Journal Requirements:
When submitting your revision, we need you to address these additional requirements.
1. Please ensure that your manuscript meets PLOS ONE’s style requirements, including those for file naming. The PLOS ONE style templates can be found at
https://journals.plos.org/plosone/s/file?id=wjVg/PLOSOne_formatting_sample_main_body.pdf and https://journals.plos.org/plosone/s/file?id=ba62/PLOSOne_formatting_sample_title_authors_affiliations.pdf
2. Please note that PLOS One has specific guidelines on code sharing for submissions in which author-generated code underpins the findings in the manuscript. In these cases, we expect all author-generated code to be made available without restrictions upon publication of the work. Please review our guidelines at https://journals.plos.org/plosone/s/materials-and-software-sharing#loc-sharing-code and ensure that your code is shared in a way that follows best practice and facilitates reproducibility and reuse.
3. We note that your Data Availability Statement is currently as follows: [All relevant data are within the manuscript and its Supporting Information files]
Please confirm at this time whether or not your submission contains all raw data required to replicate the results of your study. Authors must share the “minimal data set” for their submission. PLOS defines the minimal data set to consist of the data required to replicate all study findings reported in the article, as well as related metadata and methods (https://journals.plos.org/plosone/s/data-availability#loc-minimal-data-set-definition).
For example, authors should submit the following data:
– The values behind the means, standard deviations and other measures reported;
– The values used to build graphs;
– The points extracted from images for analysis.
Authors do not need to submit their entire data set if only a portion of the data was used in the reported study.
If your submission does not contain these data, please either upload them as Supporting Information files or deposit them to a stable, public repository and provide us with the relevant URLs, DOIs, or accession numbers. For a list of recommended repositories, please see https://journals.plos.org/plosone/s/recommended-repositories.
If there are ethical or legal restrictions on sharing a de-identified data set, please explain them in detail (e.g., data contain potentially sensitive information, data are owned by a third-party organization, etc.) and who has imposed them (e.g., an ethics committee). Please also provide contact information for a data access committee, ethics committee, or other institutional body to which data requests may be sent. If data are owned by a third party, please indicate how others may request data access.
4. We note that Figure 1 in your submission contains map images which may be copyrighted. All PLOS content is published under the Creative Commons Attribution License (CC BY 4.0), which means that the manuscript, images, and Supporting Information files will be freely available online, and any third party is permitted to access, download, copy, distribute, and use these materials in any way, even commercially, with proper attribution. For these reasons, we cannot publish previously copyrighted maps or satellite images created using proprietary data, such as Google software (Google Maps, Street View, and Earth). For more information, see our copyright guidelines: http://journals.plos.org/plosone/s/licenses-and-copyright.
We require you to either (1) present written permission from the copyright holder to publish these figures specifically under the CC BY 4.0 license, or (2) remove the figures from your submission:
1. You may seek permission from the original copyright holder of Figure 1 to publish the content specifically under the CC BY 4.0 license.
We recommend that you contact the original copyright holder with the Content Permission Form (http://journals.plos.org/plosone/s/file?id=7c09/content-permission-form.pdf) and the following text:
“I request permission for the open-access journal PLOS ONE to publish XXX under the Creative Commons Attribution License (CCAL) CC BY 4.0 (http://creativecommons.org/licenses/by/4.0/). Please be aware that this license allows unrestricted use and distribution, even commercially, by third parties. Please reply and provide explicit written permission to publish XXX under a CC BY license and complete the attached form.”
Please upload the completed Content Permission Form or other proof of granted permissions as an “Other” file with your submission.
In the figure caption of the copyrighted figure, please include the following text: “Reprinted from [ref] under a CC BY license, with permission from [name of publisher], original copyright [original copyright year].”
2. If you are unable to obtain permission from the original copyright holder to publish these figures under the CC BY 4.0 license or if the copyright holder’s requirements are incompatible with the CC BY 4.0 license, please either i) remove the figure or ii) supply a replacement figure that complies with the CC BY 4.0 license. Please check copyright information on all replacement figures and update the figure caption with source information. If applicable, please specify in the figure caption text when a figure is similar but not identical to the original image and is therefore for illustrative purposes only.
The following resources for replacing copyrighted map figures may be helpful:
USGS National Map Viewer (public domain): http://viewer.nationalmap.gov/viewer/
The Gateway to Astronaut Photography of Earth (public domain): http://eol.jsc.nasa.gov/sseop/clickmap/
Maps at the CIA (public domain): https://www.cia.gov/library/publications/the-world-factbook/index.html and https://www.cia.gov/library/publications/cia-maps-publications/index.html
NASA Earth Observatory (public domain): http://earthobservatory.nasa.gov/
Landsat: http://landsat.visibleearth.nasa.gov/
USGS EROS (Earth Resources Observatory and Science (EROS) Center) (public domain): http://eros.usgs.gov/#
Natural Earth (public domain): http://www.naturalearthdata.com/
5. We note that Figures 1 (Figure 1 Monkeypox clinic’s website), 2 (Figure 2 Sample images from the study dataset), 3, 4, 5, and 7 in your submission contain copyrighted images. All PLOS content is published under the Creative Commons Attribution License (CC BY 4.0), which means that the manuscript, images, and Supporting Information files will be freely available online, and any third party is permitted to access, download, copy, distribute, and use these materials in any way, even commercially, with proper attribution. For more information, see our copyright guidelines: http://journals.plos.org/plosone/s/licenses-and-copyright.
We require you to either (1) present written permission from the copyright holder to publish these figures specifically under the CC BY 4.0 license, or (2) remove the figures from your submission:
1. You may seek permission from the original copyright holder of Figures 1 (Figure 1 Monkeypox clinic’s website), 2 (Figure 2 Sample images from the study dataset), 3, 4, 5, and 7 to publish the content specifically under the CC BY 4.0 license.
We recommend that you contact the original copyright holder with the Content Permission Form (http://journals.plos.org/plosone/s/file?id=7c09/content-permission-form.pdf) and the following text:
“I request permission for the open-access journal PLOS ONE to publish XXX under the Creative Commons Attribution License (CCAL) CC BY 4.0 (http://creativecommons.org/licenses/by/4.0/). Please be aware that this license allows unrestricted use and distribution, even commercially, by third parties. Please reply and provide explicit written permission to publish XXX under a CC BY license and complete the attached form.”
Please upload the completed Content Permission Form or other proof of granted permissions as an “Other” file with your submission.
In the figure caption of the copyrighted figure, please include the following text: “Reprinted from [ref] under a CC BY license, with permission from [name of publisher], original copyright [original copyright year].”
2. If you are unable to obtain permission from the original copyright holder to publish these figures under the CC BY 4.0 license or if the copyright holder’s requirements are incompatible with the CC BY 4.0 license, please either i) remove the figure or ii) supply a replacement figure that complies with the CC BY 4.0 license. Please check copyright information on all replacement figures and update the figure caption with source information. If applicable, please specify in the figure caption text when a figure is similar but not identical to the original image and is therefore for illustrative purposes only.
6. Please renumber your figures and update the corresponding citations in the text to ensure they follow a sequential order.
If the reviewer comments include a recommendation to cite specific previously published works, please review and evaluate these publications to determine whether they are relevant and should be cited. There is no requirement to cite these works unless the editor has indicated otherwise.
Additional Editor Comments:
PLOS ONE Editorial Decision
Manuscript Number: PONE-D-25-66974
Title: AI-Driven Diagnosis of Monkeypox using Deep Learning Models
Authors: Bassam W. Aboshosha, Shafiq Ul Rehman, Lamees N. Mahmoud, Ibrahim Sadek
Dear Dr. Sadek and colleagues,
Thank you for submitting your manuscript to PLOS ONE. I have now completed a thorough assessment of your submission, including the two reviewer reports and my own detailed evaluation. The manuscript addresses a timely and clinically relevant topic, the application of deep learning for mpox diagnosis using skin image analysis. The proposed integration of this diagnostic capability into an “unmanned smart clinic” concept demonstrates awareness of real-world deployment challenges, particularly in resource-limited settings. These elements represent genuine strengths. However, after careful review, I must concur with the reviewers that the manuscript in its current form does not meet the standards for publication in PLOS ONE. The concerns raised are fundamental and extend beyond minor revision.
Summary of Critical Issues
1. The Methodological Contribution is Insufficient
Reviewer 1’s assessment is direct and, in my judgment, accurate: “There is no novelty in the methodology. This study is totally relied on established architectures without any significant advancement.” The manuscript evaluates five standard pre-trained CNN architectures (MobileNet, DenseNet121, ResNet50, Inception-v3, EfficientNet) using a publicly available Kaggle dataset. The core methodology, transfer learning with fine-tuning on medical images, is well-established and has been extensively applied to mpox detection in the literature, as the authors’ own extensive reference list demonstrates (over 45 cited studies on this exact topic).
The critical question: What does this study add that is not already present in the existing literature? The authors do not articulate a clear methodological innovation, a novel architectural modification, a new training strategy, or a substantive advance in how these models are applied. Without such a contribution, the manuscript reads as a replication study, which, while potentially valuable, does not constitute the original research expected by PLOS ONE.
2. The Literature Review is Incomplete and the Contribution is Unclear
Reviewer 2 correctly notes that the literature review “doesn’t provide comprehensive coverage of related work” and identifies a “significant gap in coverage of the state-of-the-art.”
This criticism is particularly salient given the sheer volume of existing work. The authors cite over 45 studies on AI-based mpox detection, yet the manuscript does not:
• Synthesize what these studies have collectively established
• Identify persistent gaps or limitations in the existing literature
• Clearly articulate how the present study addresses those gaps
• Demonstrate why another comparative evaluation of standard models is needed
The introduction states the study’s contributions as: (1) developing AI-driven diagnostic models, (2) proposing a smart unmanned medical clinic concept, (3) presenting a comparative analysis, and (4) supporting AI-enhanced healthcare. However:
• Contribution (1) is not novel, dozens of studies have already developed such models
• Contribution (2) is a conceptual proposal, not empirically validated in this study
• Contribution (3) is descriptive, not analytical, it does not generate new insights about why certain models perform better or how they could be improved
• Contribution (4) is a general aspiration, not a specific finding
The manuscript needs a clearly articulated research gap and a specific research question that this study answers. Without this, the contribution remains unclear.
3. The Dataset Description is Inadequate
Reviewer 2 notes: “There is no such sub-section mentioning the details about the dataset size. I couldn’t find anything regarding the size or quantity of the dataset.”
This is a serious omission. Table 2 provides class distributions for training, validation, and test sets, but critical information is missing:
• Source: The authors state the dataset was obtained from Kaggle and “has previously been used in research.” Which specific Kaggle dataset? What is its original source? How were images collected? What are the inclusion/exclusion criteria?
• Verification: “Each image of a skin lesion was double-checked using references and Google’s reverse image search.” This is insufficient for clinical-grade data. What were the verification criteria? Who performed the verification? What was the inter-rater reliability?
• Characteristics: What are the image resolutions? What are the demographic characteristics of the patients represented? What are the lesion locations, stages, and presentations? Are there multiple images per patient?
• Confounders: Are there potential confounders such as image quality differences between classes, background variations, or lighting conditions that could introduce bias?
Without this information, the validity of the results cannot be assessed. The near-perfect performance of EfficientNet (99.64% accuracy) raises concerns about potential data leakage, overfitting, or dataset biases that cannot be evaluated without detailed dataset documentation.
4. The Experimental Details are Insufficient for Reproducibility
Reviewer 2 raises multiple concerns about experimental transparency:
• “It is not clear how the authors used the embedding techniques.”
• “It is not clear how the authors fine-tuned the model.”
• “It is not clear how the parameters of the models are compared.”
Critical missing information includes:
• Preprocessing details: Beyond “poor-quality images were eliminated,” what were the specific criteria? What preprocessing steps were applied (resizing, normalization, color space conversion)?
• Augmentation details: Which specific augmentations were applied? With what parameters? Was augmentation applied only to training data, or also to validation/test data?
• Training details: What was the optimization algorithm? Learning rate? Batch size? Number of epochs? Early stopping criteria? Loss function?
• Fine-tuning details: Which layers were frozen vs. fine-tuned? What were the initial and final layer configurations?
• Hardware/software: What computing infrastructure was used? What frameworks and versions?
• Hyperparameter selection: How were hyperparameters chosen? Was there a validation-based selection process?
Without these details, the experiments cannot be reproduced or critically evaluated.
5. The Reported Performance Raises Concerns
EfficientNet achieving 99.64% validation accuracy with 100% precision and recall (zero false positives, zero false negatives) on a medical image classification task is extraordinarily high.
This level of performance warrants critical scrutiny:
• Class imbalance: The dataset is nearly balanced (1,428 mpox, 1,376 normal), so imbalance is not an explanation.
• Dataset size: 2,804 images is modest for deep learning. With perfect performance, one must consider whether the test set is too easy, whether there is data leakage between train/validation/test, or whether the dataset contains systematic biases that the model has learned.
• Comparison to literature: The authors’ own Table 4 shows that most published studies report accuracies in the 82-98% range, with only a few achieving >99%. What explains this study’s superior performance?
The manuscript does not address these concerns. There is no analysis of difficult cases, no error analysis (because there are no errors), no discussion of potential dataset limitations, and no external validation.
6. The “Unmanned Smart Clinic” Concept is Underdeveloped
The proposal of an unmanned smart clinic is conceptually interesting but:
• It is not integrated with the core analysis. The clinic concept is described in Section 3, but the AI models are evaluated in isolation. There is no demonstration or validation of how these models would function within such a clinic.
• Operational details are missing. How would image capture be standardized? What would prevent users from submitting poor-quality images? How would the system handle uncertainty or edge cases? What would be the workflow for positive vs. negative results?
• Implementation challenges are not addressed. Connectivity, data privacy, regulatory approval, user acceptance, and integration with existing health systems are not discussed.
As presented, this section reads as a conceptual illustration rather than a substantive contribution.
7. The Literature Comparison Table is Problematic
Table 4 attempts to compare this study with existing work, but it contains multiple issues:
• Inconsistent reporting: Some entries report accuracy with percentages, others without. Some include confidence intervals, most do not.
• Missing context: The table does not indicate dataset sizes, class distributions, or validation methodologies, making comparisons meaningless.
• Self-citation: The table includes “This study” at the end, but the comparison is superficial.
• Errors: Reference numbering in the table appears inconsistent with the reference list.
A proper comparison would require standardized metrics, dataset characteristics, and validation approaches, none of which are provided.
8. The Writing and Presentation Require Substantial Improvement
Beyond the methodological issues, the manuscript has significant presentation problems:
• Redundancy: The introduction repeats information about mpox symptoms and transmission across multiple paragraphs.
• Organization: Section 4 (“Methodology”) includes subsections that could be better structured. The mathematical notation in lines 46-136 appears to be from a different manuscript (it references “this section” and includes theorems that are not used in the analysis).
• Figures: Figures 8-14 are difficult to interpret. Some are low-resolution, others have illegible text. The precision-recall curves lack threshold annotations.
• Table formatting: Table 1 extends across multiple pages with inconsistent formatting. Table 3 presents metrics without confidence intervals.
• References: The reference list is overly long (48 references) but not well-integrated into the text. Many references are cited in blocks without specific attribution.
Specific Required Revisions
If the authors wish to resubmit, the following must be addressed comprehensively. This represents a major revision at minimum, and the authors should carefully consider whether the current study can be revised to meet the required standards.
A. Clarify the Novelty and Contribution (Required)
• Conduct a thorough literature review and clearly articulate the specific gap this study addresses.
• State explicit research questions or hypotheses.
• Demonstrate what this study adds beyond existing work, methodological innovation, new insights, or practical advances.
B. Provide Complete Dataset Documentation (Required)
• Specify the exact Kaggle dataset (URL, version, source).
• Provide detailed inclusion/exclusion criteria for image selection.
• Report image characteristics (resolution, format, quality metrics).
• Describe the verification process in detail, including who performed it and how reliability was ensured.
• Disclose any potential confounders or biases in the dataset.
C. Provide Complete Experimental Details (Required)
• Document all preprocessing steps with specific parameters.
• List all augmentation techniques with parameters and rationale.
• Report training hyperparameters (optimizer, learning rate, batch size, epochs, loss function).
• Describe fine-tuning strategy (which layers frozen, learning rates for different layers).
• Specify hardware and software environment.
• Detail the hyperparameter selection process.
D. Address Performance Concerns (Required)
• Conduct and report cross-validation results (not just a single train/validation/test split).
• Provide confidence intervals for all performance metrics.
• Report performance on multiple metrics, including sensitivity, specificity, PPV, NPV, and F1-score for each class.
• Analyze difficult cases, what images were misclassified (if any) and why?
• If performance remains perfect, discuss potential explanations and limitations.
E. Validate on External Data (Strongly Recommended)
• Test the models on an independent dataset not used in development.
• If external validation is not possible, explicitly discuss this as a major limitation.
F. Develop the Clinic Concept or Remove It (Required)
• Either integrate the clinic concept with empirical validation (e.g., testing the models under simulated clinic conditions, analyzing image quality variations), or remove it and focus on the core diagnostic analysis.
• If retained, address operational, regulatory, and implementation challenges.
G. Revise the Literature Comparison (Required)
• Create a meaningful comparison table with standardized metrics and dataset characteristics.
• Discuss why performance differs across studies.
• Acknowledge limitations in cross-study comparisons.
H. Improve Writing and Presentation (Required)
• Restructure the manuscript with clear sections: Introduction, Related Work, Methods, Results, Discussion, Conclusion.
• Remove redundant content.
• Ensure all figures are high-resolution with legible text and self-explanatory captions.
• Reformatted tables for clarity and consistency.
• Review and revise references to ensure accurate citation and formatting per PLOS ONE style.
I. Address Reviewer 2’s Specific Concerns (Required)
• Add objectives and motivations tied to literature gaps.
• Add research questions.
• Cite and discuss missing relevant literature (e.g., the works suggested by Reviewer 2).
• Discuss challenges in the work and the dataset.
• Identify avenues for future research.
Decision: Major Revision Required
Given the above, I cannot recommend acceptance in the current form. The manuscript does not meet PLOS ONE’s standards for methodological rigor, novelty, transparency, or reproducibility.
The authors may choose to resubmit a substantially revised manuscript addressing all of the concerns outlined above. Any resubmission will be evaluated de novo and will be sent for additional peer review. Given the fundamental nature of the concerns, particularly regarding novelty, the authors should carefully consider whether the revised manuscript can demonstrate a clear contribution. If the authors believe these concerns cannot be adequately addressed, they may wish to consider alternative venues more appropriate for replication studies or methodological validations. I thank the authors for their work on an important public health problem and encourage them to consider how their approach might be advanced to make a more distinctive contribution.
Sincerely,
Morufu Olalekan Raimi, PhD
Academic Editor
PLOS ONE
[Note: HTML markup is below. Please do not edit.]Reviewers’ comments:
Reviewer’s Responses to Questions
–>Comments to the Author
1. Is the manuscript technically sound, and do the data support the conclusions?
The manuscript must describe a technically sound piece of scientific research with data that supports the conclusions. Experiments must have been conducted rigorously, with appropriate controls, replication, and sample sizes. The conclusions must be drawn appropriately based on the data presented. –>
Reviewer #1: No
Reviewer #2: Yes
**********
–>2. Has the statistical analysis been performed appropriately and rigorously? –>
Reviewer #1: No
Reviewer #2: N/A
**********
–>3. Have the authors made all data underlying the findings in their manuscript fully available?
The PLOS Data policy requires authors to make all data underlying the findings described in their manuscript fully available without restriction, with rare exception (please refer to the Data Availability Statement in the manuscript PDF file). The data should be provided as part of the manuscript or its supporting information, or deposited to a public repository. For example, in addition to summary statistics, the data points behind means, medians and variance measures should be available. If there are restrictions on publicly sharing data—e.g. participant privacy or use of data from a third party—those must be specified.–>
Reviewer #1: No
Reviewer #2: Yes
**********
–>4. Is the manuscript presented in an intelligible fashion and written in standard English?
PLOS ONE does not copyedit accepted manuscripts, so the language in submitted articles must be clear, correct, and unambiguous. Any typographical or grammatical errors should be corrected at revision, so please note any specific errors here.–>
Reviewer #1: No
Reviewer #2: Yes
**********
–>5. Review Comments to the Author
Please use the space provided to explain your answers to the questions above. You may also include additional comments for the author, including concerns about dual publication, research ethics, or publication ethics. (Please upload your review as an attachment if it exceeds 20,000 characters)–>
Reviewer #1: There is no novelty in the methodology. This study is totally relied on established architectures without any significant advancement. The paper is not suitable for a reputable journal like plos one.
Reviewer #2: The manuscript presents several significant issues that need to be addressed before it can be considered for publication. Please find my detailed comments and concerns below:
1. Please add two paragraphs in the introduction: a) objectives and motivations tied to gaps in the literature; b) research questions.
2. The literature review of the article doesn’t provide comprehensive coverage of related work. Most troublesome is the significant gap in coverage of the state-of-the-art. A few important pieces of literature about deep learning are not cited, for example.
(a). Monkeypox recognition and prediction from visuals using deep transfer learning-based neural networks, DOI: https://link.springer.com/article/10.1007/s11042-024-18437-z
3. It is not clear how the authors used the embedding techniques. Please provide more explanations.
4. It is not clear how the authors fine-tuned the model. Please add experiments and details.
5. It is not clear how the parameters of the models are compared.
6. I would strongly advise including all major works in 2023 and 2024-25 and drawing a tabular comparison between your work and other works. A few works worth comparing, referring to, or citing are below:
(b). A CNN-LSTM-Based Hybrid Deep Learning Approach for Sentiment Analysis on Monkeypox Tweets
DOI: https://link.springer.com/article/10.1007/s00354-023-00227-0
7. There is no such sub-section mentioning the details about the dataset size. I couldn’t find anything regarding the size or quantity of the dataset.
8. I’d recommend adding some possible improvements for the proposed approach.
9. What are the avenues for future research or improvements identified based on the findings of this study?
10. The challenges in the work need to be stated (As mentioned in the title).
11. What are the challenges in the dataset?
**********
–>6. PLOS authors have the option to publish the peer review history of their article (what does this mean?). If published, this will include your full peer review and any attached files.
If you choose “no”, your identity will remain anonymous but your review may still be made public.
Do you want your identity to be public for this peer review? For information about this choice, including consent withdrawal, please see our Privacy Policy.–>
Reviewer #1: Yes: Dr. Tayyaba Anees
Reviewer #2: Yes: Dr. Gaurav Meena
**********
[NOTE: If reviewer comments were submitted as an attachment file, they will be attached to this email and accessible via the submission site. Please log into your account, locate the manuscript record, and check for the action link “View Attachments”. If this link does not appear, there are no attachment files.]To ensure your figures meet our technical requirements, please review our figure guidelines: https://journals.plos.org/plosone/s/figures
You may also use PLOS’s free figure tool, NAAS, to help you prepare publication quality figures: https://journals.plos.org/plosone/s/figures#loc-tools-for-figure-preparation.
NAAS will assess whether your figures meet our technical requirements by comparing each figure against our figure specifications.
27 Apr 2026
POINT-BY-POINT RESPONSE TO EDITOR AND REVIEWER COMMENTS
=========================================================
Manuscript ID: PONE-D-25-66974
Manuscript Title: AI-Driven Diagnosis of Monkeypox using Deep Learning Models
We sincerely thank the Associate Editor, Dr. Morufu Olalekan Raimi, and the two Reviewers for their thorough and constructive evaluation. Every concern has been carefully considered and has led to a substantially revised manuscript. Below we provide a detailed point-by-point response. All referenced sections, tables, and figures refer to the revised manuscript.
=========================================================
RESPONSE TO ASSOCIATE EDITOR
=========================================================
EDITOR CONCERN 1: Insufficient Methodological Contribution
———————————————————–
“There is no novelty in the methodology. This study is totally relied on established architectures without any significant advancement.”
RESPONSE:
We fully agree that the former manuscript did not clearly articulate its contribution and read as a replication study. The revised manuscript has been completely restructured. The contribution is now explicitly framed as methodological rather than architectural. The study does not propose a new backbone; instead, it provides a unified curation recipe, a leakage-aware validation design, and fold-wise reference results intended to support defensible comparison with prior and future mpox skin-image studies.
Specifically, the revised Introduction (Section 1) states three objectives: (1) construct a unified curated binary dataset with fully specified class-mapping and selection rules; (2) compare multiple pretrained models and a weighted ensemble under a shared pipeline; and (3) examine how dataset construction and leakage-aware evaluation influence the interpretation of performance on public mpox lesion data. Three research questions (RQ1-RQ3) are enumerated to precisely define the scope.
This repositioning addresses the novelty concern by delineating what the study contributes (a rigorous, auditable benchmark design) from what it does not claim (a new architecture).
EDITOR CONCERN 2: Literature Review Incomplete, Contribution Unclear
———————————————————————
“The literature review doesn’t provide comprehensive coverage of related work. Most troublesome is the significant gap in coverage of the state-of-the-art.”
RESPONSE:
Section 2 (Related work) has been entirely rewritten. It now includes a narrative review of 14 peer-reviewed studies spanning 2022-2025, covering transfer learning, explainable AI, ensemble methods, mobile deployment, and optimization-based approaches. A new standardized comparison table (Table 1) presents 12 representative studies with five columns: Study, Task/dataset, Split/validation, Best reported result, and Comparability limitation. Each row explicitly explains why direct comparison with the present benchmark is limited, preventing misleading leaderboard-style comparisons.
The research gap is now clearly identified in the Introduction: heterogeneous benchmarking practices prevent meaningful comparison across studies. This is supported by recent critiques from Hossain et al. (2025), who highlighted dataset quality and inconsistent benchmarking as major barriers, and Vega et al. (2023), who showed that some early mpox datasets contained flawed or medically irrelevant web-scraped content.
The following studies have been added to strengthen the coverage:
– Thieme et al. (2023, Nature Medicine): deep-learning classification of mpox skin lesions with geographically diverse clinical validation
– Pramanik et al. (2023, PLOS ONE): CNN amalgamation with Beta function-based normalization
– Aslam et al. (2024): deep transfer-learning approach for monkeypox visual recognition (as requested by Reviewer 2)
– Khan et al. (2023): CNN-LSTM sentiment analysis on monkeypox tweets (as requested by Reviewer 2)
– Elhadidy et al. (2025): multiclass benchmarking on MSLD v2.0
EDITOR CONCERN 3: Dataset Description Inadequate
————————————————-
“There is no such sub-section mentioning the details about the dataset size. I couldn’t find anything regarding the size or quantity of the dataset.”
RESPONSE:
Section 3.2 (Unified dataset construction) now provides complete documentation:
– Sources: MSLD v1.0 (cited via Almufareh et al. 2023) and MSLD v2.0 (cited via Ali et al. 2024), both publicly available repositories.
– Size: 876 original images (339 mpox, 537 non-mpox) and 1,357 total images including augmented variants.
– Class distribution: 38.7% mpox / 61.3% non-mpox. The majority-class baseline accuracy (ZeroR = 0.613) is reported in the Results section to contextualize model performance.
– Input resolution: All images resized to 224 x 224 pixels.
– Normalization: ImageNet mean and standard deviation.
– Class mapping: Explicit rules for how MSLD v1.0 and v2.0 categories were mapped to the binary mpox/non-mpox labels.
Section 3.3 (Leakage control, grouping, and split policy) provides:
– Grouping: 617 filename-derived groups using a specified regular expression, with an average of 1.42 images per group and a maximum of 14.
– Near-duplicate audit: A 64-bit perceptual-hash (pHash) audit was conducted over all 876 original images. The audit identified 95 candidate near-duplicate pairs (Hamming distance <= 10); in every case, both members belonged to the same cross-validation fold, yielding zero cross-fold leaks.
– Augmentation control: Augmented images capped at 3 variants per group (citing Shorten and Khoshgoftaar 2019); original-image training ratio set to 0.70.
– Potential confounders: The Discussion acknowledges that source-level heterogeneity (different acquisition devices, lighting conditions, and racial diversity profiles between MSLD v1.0 and v2.0) is a primary driver of fold-level variability.
EDITOR CONCERN 4: Experimental Details Insufficient for Reproducibility
————————————————————————
“Critical missing information includes: preprocessing details, augmentation details, training details, fine-tuning details, hardware/software, hyperparameter selection.”
RESPONSE:
All requested experimental details are now fully documented:
– Preprocessing: Images resized to 224 x 224, normalized with ImageNet mean [0.485, 0.456, 0.406] and standard deviation [0.229, 0.224, 0.225]. Augmented images excluded from fold construction and from all test/validation evaluations.
– Augmentation: Augmented variants used only during training, capped at 3 per group. Online augmentation parameters (MixUp alpha, CutMix alpha, RandAugment) are reported per backbone in Table 3.
– Training: Optimizer, learning rate, weight decay, label smoothing, loss function (cross-entropy or focal), scheduler, warmup epochs, gradient clipping, and drop-path rate are reported per backbone in Tables 2-3. These were selected by an NSGA-II multi-objective hyperparameter search (840 trials, 6 epochs each).
– Fine-tuning: After main training, a 5-epoch fine-tuning phase at lr = 1e-5 was applied on original-only training data to address the augmented-to-original domain shift. All layers were unfrozen. MixUp and CutMix were disabled during fine-tuning.
– Early stopping: Patience = 4 epochs, monitored metric = f1_at_precision on the validation set.
– Hardware: NVIDIA A100 (40 GB) GPU for training; NVIDIA GeForce RTX 4060 Laptop GPU for TTA ablation re-evaluation (Section 3.9).
– Software: Python 3.10, PyTorch 2.1, torchvision 0.16, Optuna 3.4, scikit-learn 1.3, SciPy 1.11, ImageHash.
– Seeds: 12345-12349 (one per fold), fixed for reproducibility.
– Compute budget: 15-25 GPU-hours total.
– Pretrained weights: torchvision ImageNet-1K V1 variants for all backbones (Section 3.9).
– Model complexity: Trainable parameters and GFLOPs (computed via the torchprofile library) are reported in Table 4.
EDITOR CONCERN 5: Near-Perfect Performance Raises Concerns
———————————————————–
“EfficientNet achieving 99.64% validation accuracy with 100% precision and recall on a medical image classification task is extraordinarily high.”
RESPONSE:
This concern has been fully resolved. The former manuscript’s near-perfect results have been replaced with substantially lower and intentionally conservative results obtained under a stricter protocol:
– Weighted ensemble: F1 = 0.8334 +/- 0.0432, AUC = 0.9388 +/- 0.0203
– Best single model (ConvNeXt-Tiny): F1 = 0.8159 +/- 0.0727, AUC = 0.9284 +/- 0.0303
These results are reported under 5-fold group-stratified cross-validation with original-only test evaluation, meaning no augmented images appear in test or validation sets. The abstract explicitly characterizes these as “deflated but more trustworthy reference values.”
Five robustness analyses substantiate the integrity of these results:
(i) A perceptual-hash near-duplicate audit confirmed zero cross-fold data leakage across all 876 images (Section 3.3).
(ii) Pre- and post-calibration Expected Calibration Error (ECE) is quantified for every model in every fold, revealing both the benefits and limits of temperature scaling (Section 4.6, Table 5).
(iii) Per-fold decision thresholds are reported with explicit verification of whether precision (>= 0.80) and recall (>= 0.85) targets were met on the test partition (Section 4.7, Table 7).
(iv) A TTA ablation using the same saved checkpoints and identical data splits demonstrates that the reported results are not critically dependent on the test-time augmentation protocol; the ensemble F1 gain from TTA is +0.009 (Section 4.8, Table 8).
(v) Four complementary statistical tests (McNemar, permutation, Wilcoxon signed-rank, DeLong) with Bonferroni correction are applied to all pairwise model comparisons (Section 4.5).
Error analysis is provided through fold-wise confusion matrix components (Table 8, showing TP, FP, TN, FN per fold) and fold-specific confusion matrix, ROC, and precision-recall plots (Figures 1-4).
EDITOR CONCERN 6: Smart Clinic Concept Underdeveloped
——————————————————
“The concept of an unmanned smart clinic is underdeveloped. It is not integrated with the core analysis.”
RESPONSE:
The smart clinic concept has been entirely removed from the revised manuscript. The paper is now purely a benchmarking study focused on methodological rigour in mpox skin-image classification. This decision was made because the clinic concept was a conceptual proposal without empirical validation, as the Editor correctly noted.
EDITOR CONCERN 7: Literature Comparison Table Problematic
———————————————————-
“The table does not indicate dataset sizes, class distributions, or validation methodologies, making comparisons meaningless.”
RESPONSE:
Table 1 has been completely redesigned as a standardized longtable with five columns: Study, Task/dataset, Split/validation, Best reported result, and Comparability limitation. It now covers 12 peer-reviewed studies spanning 2022-2025. Each entry documents the dataset size, class structure, validation strategy, and best reported result, alongside a specific explanation of why direct comparison with the present benchmark is limited (e.g., “binary evaluation performed on an augmented four-class pool,” “headline accuracy is a validation figure obtained during hyperparameter search,” “model ranking reverses across datasets”). The present study is included as the final row with a gray highlight. This design ensures that readers can assess comparability rather than simply rank headline numbers.
EDITOR CONCERN 8: Writing and Presentation
——————————————-
“The manuscript has significant presentation problems: redundancy, organization, figures, table formatting, references.”
RESPONSE:
The manuscript has been completely rewritten and restructured:
– Structure: Introduction, Related work, Materials and methods (with 9 subsections), Results (with 9 subsections including new calibration, threshold, and TTA analyses), Discussion, Conclusion. No redundancy between sections.
– Figures: All figures are in PNG format with self-explanatory captions that expand all acronyms and explain color/linestyle legends. Confusion matrices, ROC curves, and precision-recall curves are presented for four representative models using different folds to avoid overemphasizing any single split.
– Tables: 9 tables, all using booktabs formatting (toprule, midrule, bottomrule) with no vertical rules. Wide tables use resizebox to prevent overflow. Statistical notation (mean +/- SD) is consistent throughout.
– References: 38 references, all integrated into the narrative with specific attribution. PLOS ONE Vancouver style (plos2025.bst). All entries include DOIs.
– Formatting: Line numbers and double spacing enabled. 10pt font, letterpaper, 1-inch margins.
EDITOR REQUIRED REVISION E: External Validation
————————————————-
“Test the models on an independent dataset not used in development. If external validation is not possible, explicitly discuss this as a major limitation.”
RESPONSE:
External validation on an independent clinical cohort was not performed in this revision. While other public mpox-related image collections exist, these differ substantially from the present benchmark in class definitions, labeling protocols, image quality, and acquisition conditions. Using them as an external test set without careful harmonization would introduce confounds that undermine the interpretability of the comparison — precisely the problem this benchmark is designed to address. Rather than report a potentially misleading external validation on incompatible data, we chose to strengthen the internal evidence base through a comprehensive suite of robustness analyses and to identify external validation on a prospectively collected, protocol-matched clinical cohort as the highest priority for future work. This limitation is explicitly acknowledged in the Discussion as the first limitation listed. However, the revised manuscript compensates for this gap with a comprehensive suite of internal robustness analyses that collectively provide stronger evidence of methodological soundness than is typical of single-dataset benchmarks:
(i) Content-level near-duplicate auditing via perceptual hashing confirmed zero cross-fold leaks across 876 images (Section 3.3).
(ii) Pre- and post-calibration ECE was quantified for every model in every fold, revealing both the benefits and limits of temperature scaling (Section 4.6).
(iii) Per-fold decision thresholds were reported with explicit verification of whether precision and recall targets were met on the test partition (Section 4.7).
(iv) A TTA ablation using the same saved checkpoints and identical data splits demonstrated that the reported results are not critically dependent on the test-time augmentation protocol (Section 4.8).
(v) Four complementary statistical tests with Bonferroni correction were applied to all pairwise model comparisons within each fold (Section 4.5).
While these analyses do not substitute for external validation, they ensure that the reported performance estimates are internally consistent, auditable, and not inflated by methodological artefacts. External validation on a prospectively collected clinical cohort is identified as the highest priority for future work in both the Limitations paragraph and the Conclusion.
=========================================================
RESPONSE TO REVIEWER 1
=========================================================
REVIEWER 1: “There is no novelty in the methodology. This study is totally relied on established architectures without any significant advancement. The paper is not suitable for a reputable journal like plos one.”
RESPONSE:
We respectfully acknowledge this concern and agree that the former manuscript failed to articulate a clear contribution. The revised manuscript has been completely reframed. The contribution is now explicitly methodological: a transparent benchmark
Attachment
Submitted filename: response_to_reviewers.docx
31 May 2026
–>PONE-D-25-66974R1–>–>AI-Driven Diagnosis of Monkeypox using Deep Learning Models–>–>PLOS One
Dear Dr. Sadek,
Thank you for submitting your manuscript to PLOS ONE. After careful consideration, we feel that it has merit but does not fully meet PLOS ONE’s publication criteria as it currently stands. Therefore, we invite you to submit a revised version of the manuscript that addresses the points raised during the review process.
Please submit your revised manuscript by Jul 15 2026 11:59PM. If you will need more time than this to complete your revisions, please reply to this message or contact the journal office at . When you’re ready to submit your revision, log on to https://www.editorialmanager.com/pone/ and select the ‘Submissions Needing Revision’ folder to locate your manuscript file.
Please include the following items when submitting your revised manuscript:–>
-
A letter that responds to each point raised by the academic editor and reviewer(s). You should upload this letter as a separate file labeled ‘Response to Reviewers’.
-
A marked-up copy of your manuscript that highlights changes made to the original version. You should upload this as a separate file labeled ‘Revised Manuscript with Track Changes’.
-
An unmarked version of your revised paper without tracked changes. You should upload this as a separate file labeled ‘Manuscript’.
–>
If you would like to make changes to your financial disclosure, please include your updated statement in your cover letter. Guidelines for resubmitting your figure files are available below the reviewer comments at the end of this letter.
If applicable, we recommend that you deposit your laboratory protocols in protocols.io to enhance the reproducibility of your results. Protocols.io assigns your protocol its own identifier (DOI) so that it can be cited independently in the future. For instructions see: https://journals.plos.org/plosone/s/submission-guidelines#loc-laboratory-protocols. Additionally, PLOS ONE offers an option for publishing peer-reviewed Lab Protocol articles, which describe protocols hosted on protocols.io. Read more information on sharing protocols at https://plos.org/protocols?utm_medium=editorial-email&utm_source=authorletters&utm_campaign=protocols.
As the corresponding author, your ORCID iD is verified in the submission system and will appear in the published article. PLOS supports the use of ORCID, and we encourage all coauthors to register for an ORCID iD and use it as well. Please encourage your coauthors to verify their ORCID iD within the submission system before final acceptance, as unverified ORCID iDs will not appear in the published article. Only the individual author can complete the verification step; PLOS staff cannot verify ORCID iDs on behalf of authors.
We look forward to receiving your revised manuscript.
Kind regards,
Morufu Olalekan Raimi, Ph.D
Academic Editor
PLOS One
Journal Requirements:
1. If the reviewer comments include a recommendation to cite specific previously published works, please review and evaluate these publications to determine whether they are relevant and should be cited. There is no requirement to cite these works unless the editor has indicated otherwise.
2. Please review your reference list to ensure that it is complete and correct. If you have cited papers that have been retracted, please include the rationale for doing so in the manuscript text, or remove these references and replace them with relevant current references. Any changes to the reference list should be mentioned in the rebuttal letter that accompanies your revised manuscript. If you need to cite a retracted article, indicate the article’s retracted status in the References list and also include a citation and full reference for the retraction notice.
Additional Editor Comments:
PLOS ONE Editorial Decision
Manuscript ID: PONE-D-25-66974_R1
Title: AI-Driven Diagnosis of Monkeypox using Deep Learning Models
Authors: Aboshosha et al.
Editor: Dr. Morufu Olalekan Raimi
Decision: Minor Revision
Summary of Evaluation
The authors have submitted a substantially revised manuscript that directly and comprehensively addresses the concerns raised in the previous round of review. The original submission suffered from a lack of methodological novelty, inadequate dataset documentation, insufficient experimental detail, near perfect but implausible performance metrics, and an underdeveloped “smart clinic” concept. The revised version has been fundamentally restructured. The paper is now explicitly framed as a methodological benchmark rather than an architectural contribution. It provides a leakage aware, group stratified five fold cross validation protocol on a unified dataset from MSLD v1.0 and v2.0. The smart clinic concept has been removed, near perfect results replaced by conservative but credible estimates (ensemble F1 = 0.8334, AUC = 0.9388), and all previously missing experimental details (preprocessing, augmentation, hyperparameter search, fine tuning, hardware/software, seeds) are now fully documented. The authors also provide a perceptual hash near duplicate audit, calibration analysis, threshold verification, test time augmentation ablation, and multiple statistical tests with Bonferroni correction. Given the rigor of the revisions, the manuscript now meets PLOS ONE’s standards for methodological transparency and reproducibility. However, a few remaining issues require attention before final acceptance.
Required Minor Revisions
1. Title inconsistency
The main manuscript (pages 17 and 63) uses “Mpox” and “Monkeypox” interchangeably in the title and abstract. Please standardize to “Mpox” throughout, consistent with current WHO terminology.
2. Table numbering discrepancies
In the point by point response, the authors refer to “Table 3” for augmentation parameters and “Table 4” for complexity, but in the manuscript, augmentation hyperparameters appear in Table 5 and complexity in Table 7. Please reconcile all cross references in the response letter to match the final manuscript’s table numbering.
3. Figure 1 caption clarity
Figure 1 (dot and whisker plot) is well constructed, but the caption should explicitly state that points are mean values across five folds and whiskers represent ±1 standard deviation. This is implied but not fully spelled out.
4. External validation statement
The Discussion correctly lists the lack of external validation as a limitation. However, the Conclusion currently states that “future work should extend this line of research through externally validated datasets.” Please add a one sentence acknowledgment in the Abstract as well, e.g., “External clinical validation remains necessary before deployment.”
5. Minor typographical corrections
o Page 41, line 359: “originally test evaluation” → “original only test evaluation”
o Page 73, Table 3: “16 fold test time augmentation” row is correct, but the caption of Table 12 (page 82) mislabels TTA as “×16” – this is fine, but ensure consistent wording (“16 fold” vs. “×16”) across the manuscript.
Editorial Comments
The authors have done an exemplary job responding to the previous criticisms. The revised benchmark is transparent, reproducible, and appropriately conservative. The removal of the smart clinic concept was necessary and correct. The new results are credible and well supported by robustness analyses. The paper now makes a clear methodological contribution to a literature that has suffered from inconsistent evaluation practices. Once the above minor corrections are made, the manuscript will be acceptable for publication in PLOS ONE.
Final decision: Minor revision. No further peer review is anticipated, but the revised manuscript will be checked for compliance with the above items.
Dr. Morufu Olalekan Raimi
PLOS ONE Academic Editor
[Note: HTML markup is below. Please do not edit.] [NOTE: If reviewer comments were submitted as an attachment file, they will be attached to this email and accessible via the submission site. Please log into your account, locate the manuscript record, and check for the action link “View Attachments”. If this link does not appear, there are no attachment files.]To ensure your figures meet our technical requirements, please review our figure guidelines: https://journals.plos.org/plosone/s/figures
You may also use PLOS’s free figure tool, NAAS, to help you prepare publication quality figures: https://journals.plos.org/plosone/s/figures#loc-tools-for-figure-preparation.
NAAS will assess whether your figures meet our technical requirements by comparing each figure against our figure specifications.
–>
3 Jun 2026
RESPONSE TO THE ACADEMIC EDITOR
Manuscript ID: PONE-D-25-66974_R1
Title: AI-Driven Diagnosis of Mpox using Deep Learning Models
Authors: Aboshosha et al.
Academic Editor: Dr. Morufu Olalekan Raimi
Decision: Minor Revision
————————————————————
Dear Dr. Raimi,
We thank you for the careful and constructive evaluation of our revised manuscript and for the positive assessment of the methodological restructuring. We are grateful for the recommendation toward acceptance. We have addressed each of the required minor revisions point by point below. For every item we indicate the action taken and the location in the revised manuscript. The editor’s comments are reproduced first, followed by our response.
Throughout this letter, all table and figure references use the final manuscript numbering, which we have re-verified against the compiled document. For convenience, the final table numbering is summarized at the end of this letter.
————————————————————
RESPONSE TO JOURNAL REQUIREMENTS
Reference list completeness and retraction check. We have reviewed the full reference list for completeness and accuracy. Every in-text citation resolves to a complete bibliographic entry (author, title, venue, year, and DOI where applicable), and there are no orphaned, duplicated, or missing references. We additionally checked the cited DOIs against Crossref and the Retraction Watch database; to the best of our knowledge none of the cited works has been retracted or carries an expression of concern. Consequently, no references were removed or replaced on these grounds, and no retraction notices are required. Should any item be identified as retracted during production, we will indicate its retracted status in the reference list and add a full citation to the corresponding retraction notice, as required.
————————————————————
REQUIRED MINOR REVISIONS
————————————————————
COMMENT 1 – Title inconsistency
Editor: The main manuscript uses “Mpox” and “Monkeypox” interchangeably in the title and abstract. Please standardize to “Mpox” throughout, consistent with current WHO terminology.
Response: We have standardized the disease terminology to “Mpox” in line with current WHO nomenclature.
– The title now reads “AI-Driven Diagnosis of Mpox using Deep Learning Models.”
– The abstract and body text now use “mpox” consistently, including the previously inconsistent descriptive passages in the Related Work section (e.g., “mpox detection from skin lesion images” and “mpox recognition from visual images”) and the class listing in the comparison table.
For accuracy, we have retained “monkeypox” only where it is scientifically correct or verbatim, namely: (i) the formal virus name “monkeypox virus (MPXV),” which WHO continues to use for the pathogen; (ii) literal dataset folder labels reproduced from the public MSLD repositories (e.g., “Monkey Pox”, “Monkeypox”), which must remain verbatim for reproducibility; (iii) the proper model name “MonkeyNet”; and (iv) bibliographic citation keys. We trust this distinction is consistent with the editor’s intent.
————————————————————
COMMENT 2 – Table numbering discrepancies
Editor: In the point-by-point response, the authors refer to “Table 3” for augmentation parameters and “Table 4” for complexity, but in the manuscript, augmentation hyperparameters appear in Table 5 and complexity in Table 7. Please reconcile all cross-references in the response letter to match the final manuscript’s table numbering.
Response: We apologize for the inconsistency in the previous response letter. We have re-verified the table numbering in the final compiled manuscript and corrected all cross-references accordingly. In the final manuscript:
– Augmentation and regularization hyperparameters appear in Table 5 (“Selected backbone-specific augmentation and regularization hyperparameters”).
– Model complexity appears in Table 7 (“Model complexity of the evaluated backbones”).
All table references in this response letter now match the final manuscript numbering (see the summary at the end of this letter). No further table-numbering inconsistencies remain.
————————————————————
COMMENT 3 – Figure 1 caption clarity
Editor: Figure 1 (dot and whisker plot) is well constructed, but the caption should explicitly state that points are mean values across five folds and whiskers represent +/- 1 standard deviation.
Response: We have revised the caption of Figure 1 to state this explicitly. It now reads:
“Cross-validation performance summary of the evaluated methods across five folds. Each point represents the mean value across the five cross-validation folds, and the whiskers represent +/- 1 standard deviation around that mean. Methods are ordered by mean F1-score.”
————————————————————
COMMENT 4 – External validation statement
Editor: The Discussion correctly lists the lack of external validation as a limitation. However, the Conclusion currently states that “future work should extend this line of research through externally validated datasets.” Please add a one-sentence acknowledgment in the Abstract as well, e.g., “External clinical validation remains necessary before deployment.”
Response: We have added the requested acknowledgment to the end of the Abstract, phrased as a logically linked closing statement rather than a standalone sentence so that it follows naturally from the methodological framing. The Abstract now closes with:
“…while highlighting the limitations of current public skin-image data. Accordingly, these results should be interpreted as a reproducible reference benchmark rather than a clinically validated diagnostic tool, and external clinical validation remains necessary before deployment.”
This complements the existing statements in the Discussion and Conclusion.
————————————————————
COMMENT 5 – Minor typographical corrections
Editor (a): “originally test evaluation” -> “original only test evaluation”.
Response: The phrasing throughout the manuscript now reads “original-only test evaluation” (e.g., in the Abstract, Related Work, Methods, Results, and Discussion). The flagged typographic form is no longer present.
Editor (b): Ensure consistent wording (“16 fold” vs. “x16”) for test-time augmentation across the manuscript.
Response: We have standardized the wording to “16-fold” throughout. Specifically:
– The shared training-and-evaluation settings table now lists the test-time augmentation value as “16-fold.”
– The TTA ablation table caption now reads “Effect of 16-fold test-time augmentation (TTA) on mean F1-score and AUC across five folds,” and its column header reads “TTA on (16-fold).”
– The running text already used “16-fold,” so the terminology is now uniform.
————————————————————
SUMMARY OF FINAL MANUSCRIPT TABLE NUMBERING (for reference)
Table 1 – Standardized comparison of representative peer-reviewed mpox skin-image studies
Table 2 – Unified dataset construction rules
Table 3 – Shared training and evaluation settings (includes the TTA = 16-fold row)
Table 4 – Selected backbone-specific optimization and loss hyperparameters
Table 5 – Selected backbone-specific AUGMENTATION and regularization hyperparameters
Table 6 – Fold-wise test performance (mean +/- SD)
Table 7 – Model COMPLEXITY of the evaluated backbones
Table 8 – Mean confusion-matrix components
Table 9 – Normalized ensemble weights per fold
Table 10 – Expected Calibration Error before/after temperature scaling
Table 11 – Validation-selected decision thresholds and test precision/recall
Table 12 – Effect of 16-fold test-time augmentation (TTA) on F1 and AUC
Figure 1 is the dot-and-whisker cross-validation performance summary.
————————————————————
We believe these revisions fully address the remaining points raised. We thank you again for the constructive review, which has further improved the clarity and consistency of the manuscript.
Sincerely,
Ibrahim Sadek, on behalf of all co-authors
Corresponding author
Attachment
Submitted filename: Response_to_Editor_R2.docx
7 Jun 2026
AI-Driven Diagnosis of Mpox using Deep Learning Models
PONE-D-25-66974R2
Dear Author,
We’re pleased to inform you that your manuscript has been judged scientifically suitable for publication and will be formally accepted for publication once it meets all outstanding technical requirements.
Within one week, you’ll receive an e-mail detailing the required amendments. When these have been addressed, you’ll receive a formal acceptance letter and your manuscript will be scheduled for publication.
An invoice will be generated when your article is formally accepted. Please note, if your institution has a publishing partnership with PLOS and your article meets the relevant criteria, all or part of your publication costs will be covered. Please make sure your user information is up-to-date by logging into Editorial Manager at Editorial Manager® and clicking the ‘Update My Information’ link at the top of the page. For questions related to billing, please contact billing support.
If your institution or institutions have a press office, please notify them about your upcoming paper to help maximize its impact. If they’ll be preparing press materials, please inform our press team as soon as possible — no later than 48 hours after receiving the formal acceptance. Your manuscript will remain under strict press embargo until 2 pm Eastern Time on the date of publication. For more information, please contact .
Kind regards,
Morufu Olalekan Raimi, Ph.D
Academic Editor
PLOS One
Additional Editor Comments (optional):
PLOS ONE Editorial Decision
Manuscript ID: PONE-D-25-66974_R2
Title: AI-Driven Diagnosis of Mpox using Deep Learning Models
Authors: Aboshosha et al.
Editor: Dr. Morufu Olalekan Raimi
Decision: Accept
Editorial Assessment
The authors have submitted a revised manuscript (R2) that fully addresses all five required minor revisions from the previous decision letter (R1). I have verified each point:
1. Title terminology – Standardized to “Mpox” throughout, with appropriate retention of “monkeypox virus (MPXV)” and dataset folder names. Compliant.
2. Table numbering – The response letter now correctly references Table 5 (augmentation) and Table 7 (complexity). No remaining discrepancies.
3. Figure 1 caption – Explicitly states that points are mean values across five folds and whiskers represent ±1 standard deviation. Sufficiently clear.
4. External validation statement – Added to the Abstract as requested, closing with: “Accordingly, these results should be interpreted as a reproducible reference benchmark rather than a clinically validated diagnostic tool, and external clinical validation remains necessary before deployment.” Acceptable.
5. Typographical corrections – “original-only test evaluation” now appears consistently; test-time augmentation terminology standardized to “16-fold” across all tables, captions, and running text.
No new issues have been introduced. The manuscript remains methodologically rigorous, transparent, and appropriately conservative in its claims. The benchmark serves as a valuable reference for the mpox imaging community.
Final Decision: Accept. No further revisions required.
Dr. Morufu Olalekan Raimi
Academic Editor, PLOS ONE
Reviewers’ comments:
PONE-D-25-66974R2
PLOS One
Dear Dr. Sadek,
I’m pleased to inform you that your manuscript has been deemed suitable for publication in PLOS One. Congratulations! Your manuscript is now being handed over to our production team.
At this stage, our production department will prepare your paper for publication. This includes ensuring the following:
* All references, tables, and figures are properly cited
* All relevant supporting information is included in the manuscript submission,
* There are no issues that prevent the paper from being properly typeset
You will receive further instructions from the production team, including instructions on how to review your proof when it is ready. Please keep in mind that we are working through a large volume of accepted articles, so please give us a few days to review your paper and let you know the next and final steps.
Lastly, if your institution or institutions have a press office, please let them know about your upcoming paper now to help maximize its impact. If they’ll be preparing press materials, please inform our press team within the next 48 hours. Your manuscript will remain under strict press embargo until 2 pm Eastern Time on the date of publication. For more information, please contact .
You will receive an invoice from PLOS for your publication fee after your manuscript has reached the completed accept phase. If you receive an email requesting payment before acceptance or for any other service, this may be a phishing scheme. Learn how to identify phishing emails and protect your accounts at https://explore.plos.org/phishing.
If we can help with anything else, please email us at .
Thank you for submitting your work to PLOS ONE and supporting open access.
Kind regards,
PLOS ONE Editorial Office Staff
on behalf of
Prof Morufu Olalekan Raimi
Academic Editor
PLOS One
Supplementary Materials
Attachment
Submitted filename: response_to_reviewers.docx
Attachment
Submitted filename: Response_to_Editor_R2.docx
Data Availability Statement
The MSLD v1.0 and MSLD v2.0 source datasets used in the unified benchmark are publicly available and are cited in the reference list [7,22]. The reproducibility materials underlying the reported tables and figures, including dataset curation materials, run configuration, command log, fold-wise summary outputs, and figure-generation code, are available at https://github.com/ibrahimsadek/mpox_monkey.

Related Posts