Tyson Foodservice operates as a critical division within Tyson Foods Inc., using its extensive protein production capabilities to supply a diverse array of foodservice clients across multiple sectors. As one of the largest protein providers in the US, Tyson Foods produces approximately 20% of the nation’s beef, pork, and chicken, which forms the foundation of
Apple leaf disease severity grading based on deep learning and the DRL-Watershed algorithm
Introduction
Apples are highly nutritious, widely cultivated economic crops known for their high yield and survival rate, making them a staple in global agriculture1. Their yield and quality have a significant impact on the agricultural economy. Yuncheng, located in southern Shanxi Province on the southeastern Loess Plateau at approximately 35°N latitude, provides an optimal environment for premium apple production. As one of the advantageous apple-growing regions on the Loess Plateau, Yuncheng boasts fertile soil, a climate characterized by cold winters and hot summers, significant annual temperature variation, and an average annual sunshine duration of 2,366.2 h. These conditions are ideal for apple cultivation. The region has abundant water resources, including freshwater from underground sources and the potential to utilize Yellow River water for irrigation. Under such favorable natural conditions, Yuncheng apples are renowned for their uniform shape, vibrant color, white flesh, smooth and delicate skin, and excellent storage properties. However, during late June, rising temperatures and increased precipitation create high-humidity, low-sunlight conditions, accelerating the spread and severity of diseases. The frequent and severe occurrence of pests and diseases has become a major limiting factor in achieving high apple yields2,3. Therefore, the timely and accurate identification of apple leaf diseases and the grading of their severity are crucial for guiding farmers in implementing targeted control measures and formulating effective management strategies. Such measures can optimize pesticide use, reduce environmental pollution, improve production efficiency and minimize unnecessary economic losses.
Traditional disease severity assessment methods largely rely on the subjective judgment of experts, agricultural technicians, and farmers4. These methods are not only time-consuming and labor-intensive but also subjective and inefficient, making them difficult to apply on a large scale. In recent years, machine learning and image processing techniques have been widely adopted to evaluate crop disease severity. Common approaches include threshold segmentation, region growing, and edge detection5,6,7,8,9. Chaudhary et al.10 converted RGB images into CIELAB, HSI, and YCbCr color spaces and used the OTSU method to detect threshold values for disease grading based on the color features of lesions and leaves. Jothiaruna et al.11 proposed a leaf disease lesion segmentation method combining color features and region growing, achieving an average segmentation accuracy of 87%. Gargade et al.12 employed K-nearest neighbors (KNN) and support vector machine (SVM) algorithms to classify leaf disease severity, achieving a classification accuracy of 99.5%. Jiang et al.13 applied K-means clustering, spectral clustering, support vector machines, random forests (RF), and KNN algorithms to assess the severity of wheat stripe rust, developing a model based on the proportion of diseased area to leaf area. Li et al.14 proposed an image processing-based method for grading the severity of grape downy mildew, using the K-means clustering algorithm to segment leaf and disease areas and a pixel counting method to calculate the ratio of diseased area to leaf area for severity classification.
With the development of artificial intelligence and deep learning technologies, deep learning-based methods for disease severity classification have gradually gained attention. These models are capable of automatically extracting deep features from large image datasets, thereby improving the accuracy of disease segmentation. Currently, disease severity classification primarily relies on two-stage models, where the first stage involves leaf segmentation, and the second stage further segments the disease regions on the leaf. Wang et al.15 proposed a two-stage model, DUNet, which integrates DeepLabV3 + and U-Net for cucumber leaf disease severity classification. In the first stage, DeepLabV3 + is used to segment the leaves from complex backgrounds, and in the second stage, U-Net segments the disease areas on the leaves. The severity is then classified by calculating the ratio of lesion pixel area to leaf pixel area. Khan et al.16 introduced an end-to-end semantic segmentation model based on deep convolutional neural networks (CNNs) to identify ten different diseases on tomato leaves, achieving an average accuracy of 97.6% on the PlantVillage database and a self-constructed dataset of 20,000 images. Wu et al.17 proposed an improved DeepLabV3 + algorithm for segmenting spot disease and brown spot disease on maple leaves, achieving a mean intersection over union (mIoU) of 90.23% and a mean pixel accuracy (MPA) of 94.75%. Disease severity classification was then performed based on pixel statistics of the segmented lesions. Baliyan et al.18 developed a deep learning model based on CNN for classifying five different severity levels of corn gray leaf spot (CGLS), achieving 95.33% detection accuracy for the highest severity images. Ji et al.19 proposed a method for detecting and evaluating grape black rot using the DeepLabV3 + model to segment the diseased leaf regions, combined with a decision rule system from pathologists to assess disease severity. Liu et al.20 utilized the PSPNet model with a MobileNetV2 backbone for apple leaf segmentation and the U-Net model with a VGG backbone for segmenting Alternaria leaf spot disease. The severity of the disease was assessed by calculating the ratio of diseased area to leaf area. Liu et al.21 introduced a multi-task distillation learning framework (MTDL) for tomato disease severity assessment, where the EfficientNet optimized by MTDL achieved 91.25% classification accuracy and 92.36% severity estimation. Xu et al.22 proposed a two-stage method, Coformer and SegCoformer, for the rapid assessment of early and late blight severity in potatoes, achieving an accuracy of 84%. Wang et al.23 developed a two-stage model, TUNet, where TRNet extracts the target cucumber leaves in the first stage, and U-Net with a ResNet50 backbone extracts the lesions in the second stage. The disease severity is then classified by calculating the ratio of the total lesion area to the entire leaf area.
Traditional image processing methods have limited feature extraction capabilities and struggle to capture fine-grained details, which affects segmentation accuracy. While existing deep learning methods have made progress in disease segmentation, they primarily focus on single-leaf images and employ two-stage models for severity classification. Although these methods can provide relatively accurate results, they are computationally intensive, inefficient, and lack flexibility for real-time applications. Additionally, most studies are limited to the classification of severity for a single type of disease. In practical applications, there is a notable lack of research on severity classification involving multiple diseases and overlapping leaves.
To address the aforementioned issues, this study proposes an improved high-resolution HRNet model combined with the DRL-watershed algorithm for assessing the severity of apple leaf diseases. The model enhances segmentation accuracy by incorporating multi-scale features while maintaining high-resolution feature representation. First, the Normalization Attention Mechanism (NAM) is introduced into the backbone feature extraction network and the encoder section to capture both local and global contextual information, thereby strengthening the model’s ability to express features of the diseased regions. Second, the combination of Focal Loss and Dice Loss functions is utilized to improve the model’s segmentation accuracy for small, imbalanced lesion areas. Finally, the DRL-Watershed algorithm is employed to accurately segment overlapping leaves, effectively addressing the issue of inaccurate disease severity evaluation for overlapping leaves in complex environments. Experimental results demonstrate that the proposed HRNet model, combined with the DRL-Watershed algorithm, can effectively distinguish overlapping leaf regions and accurately assess disease severity for each individual leaf. This approach resolves the issue of inaccurate disease assessment in real-world scenarios involving overlapping leaves, and provides technical support for apple leaf disease management and control.
Materials and methods
Dataset construction
To ensure the quality and representativeness of the dataset, this study focused on Fuji apple leaves from Yuncheng City, Shanxi Province, China. Data collection was conducted between June and September 2023, capturing images under all weather conditions during three time periods: morning, midday, and evening. A Xiaomi 10 smartphone was used for image acquisition, with each image having a resolution of 1080 × 1080 pixels. Additionally, to enrich the dataset and enhance the robustness of the model, a subset of data from the publicly available AppleLeaf9 dataset on AI Studio was incorporated into this study.
Apple leaf disease dataset composition
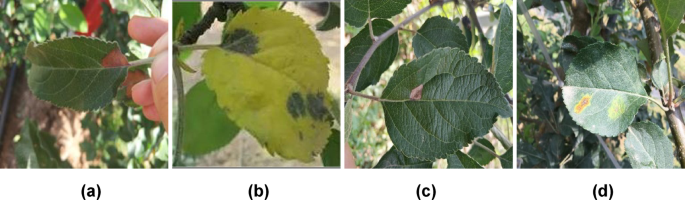
A total of 417 images of apple leaf diseases were manually selected from the collected data, covering four types of diseases: Alternaria Blotch, Brown Spot, Gray Spot, and Rust. Some sample images are shown in Fig. 1.

Examples of the four disease types. (a) Alternaria Blotch; (b) Brown Spot; (c) Gray Spot; (d) Rust
Full size image
The apple leaves and disease regions were annotated using the polygon annotation mode of the Labelme tool. The annotated images are shown in Fig. 2. The apple leaf region is marked in red, while the four types of diseases-Alternaria Blotch, Brown Spot, Gray Spot, and Rust, are indicated in green, yellow, blue, and purple, respectively.

Example of Image Annotation. (a) Alternaria Blotch; (b) Brown Spot; (c) Gray Spot; (d) Rust
Full size image
Data preprocessing
To prevent overfitting and sample bias, and to improve the model’s generalization ability and robustness, data augmentation was applied to the original dataset using three techniques: rotation, brightness perturbation, and horizontal flipping. Sample images after data augmentation are shown in Fig. 3.

Example of Data Augmentation. (a) Original image; (b) Horizontal flip; (c) Rotate 90 degrees; (d) Rotate 180 degrees; (e) Brightness enhanced by 1.5 times; (f) Brightness enhanced by 0.5 times
Full size image
Dataset partitioning
The dataset was divided into three subsets: training, validation, and testing. The training set was used to train the model, adjusting its parameters based on the features and labels in the data to capture underlying patterns. The validation set was employed for model tuning during the training process, assisting in selecting appropriate hyperparameters and preventing overfitting. The test set was used to evaluate the final model’s performance, providing an objective measure of its ability to generalize to unseen data. To ensure the dataset’s representativeness, each subset was composed of real-world apple leaf data. The dataset was partitioned as follows: the training, validation, and test sets were divided in an 8:1:1 ratio. For detailed augmentation methods, refer to Section 2.1.2.
The distribution of the dataset before and after data augmentation is shown in Table 1.
Full size table
Figure 4 illustrates the distribution of severity levels in the test set across three categories: Single Blade (inner ring), Multiple Leaf Separation (middle ring), and Multiple Leaf Overlap (outer ring). Each ring represents a different type of leaf occlusion condition, and the segments are color-coded based on severity levels (Level 0 to Level 9).

Test Dataset Severity Distribution
Full size image
Improved HRNet based semantic segmentation algorithm for Apple leaf disease
Wang et al.24 proposed the High-Resolution Network (HRNet) for 2D human pose estimation, which, due to its unique parallel structure, maintains high resolution during feature extraction and has been subsequently applied to image semantic segmentation tasks. The HRNet model effectively captures fine-grained spatial and contextual information by fusing features of different resolutions through a parallel multi-scale feature extraction structure. Additionally, HRNet uses cross-resolution connections to enhance feature propagation and fusion, thereby improving the accuracy of disease region identification in complex backgrounds.
Despite its promising performance on apple leaf disease datasets, the HRNet model still faces several challenges. While HRNet preserves high-resolution features, its ability to distinguish between diseased and healthy regions is limited. Furthermore, the standard convolutional operations in HRNet fail to fully capture the complex contextual information between the disease and healthy regions, potentially leading to the omission of valuable feature information during the feature extraction process in the encoder. Additionally, HRNet struggles with the class imbalance between diseased and healthy areas, which impacts overall segmentation accuracy. By redesigning the HRNet model, its segmentation performance can be significantly optimized, overcoming these limitations.
To improve the segmentation performance and address these shortcomings, the following modifications were made to the original HRNet model:
(1) Feature Extraction Network: To achieve an optimal balance between model complexity and parameter efficiency, HRNet_w32 was selected as the backbone feature extraction network for the encoder. This configuration includes 32 basic convolutional layers, which maintain high-resolution feature representation while reducing model complexity.
(2) Normalization Attention (NAM): NAM was introduced between the ResBlocks in each Stage module to enhance the fusion of feature information. The primary function of the ResBlock is to integrate information from different sources and improve the model’s ability to represent the required features. However, it may also introduce noisy information. The NAM effectively weights useful information, enhancing the model’s ability to focus on key features while reducing the influence of redundant or noisy information. Furthermore, NAM was applied during the feature fusion process between Stages, further improving the model’s attention to important features and making the fusion of features at different resolutions more precise. This, in turn, improves overall segmentation performance and the accuracy of disease recognition.
(3) Loss Function Optimization: A hybrid loss function combining Dice Loss and Focal Loss was employed. Dice Loss helps to reduce the influence of difficult-to-categorize samples (disease regions) and improves the accuracy of disease region segmentation. While Focal Loss enhances the model’s sensitivity to minority classes and effectively solves the category imbalance problem.
The architecture of the proposed Improved HRNet network is shown in Fig. 5.

Architecture of the Improved HRNet Network
Full size image
Normalization attention mechanism
The Normalization Attention Mechanism (NAM) is a lightweight and efficient attention module that includes two submodules: spatial attention and channel attention. It uses the scaling factor in batch normalization (BN) to measure the variance of each channel, indicating the importance of the input feature map channels. By suppressing less significant feature variations, NAM enhances the representation of more prominent channel features. As shown in Fig. 6, after feature extraction through five CBL layers, the resulting feature map is processed separately through both the spatial attention and channel attention modules and subsequently fused. The fused feature map is then multiplied by the input feature map for adaptive feature refinement, which highlights the key features of the target.

Normalization attention module
Full size image
Loss function optimization
In the apple leaf disease segmentation task, to address the issue of class imbalance and improve the model’s ability to handle hard-to-classify samples, we introduce two loss functions: Focal Loss and Dice Loss.
Focal Loss is an enhanced version of the cross-entropy loss, specifically designed to mitigate class imbalance. By introducing a modulation factor, it reduces the loss contribution from easy-to-classify samples, thereby focusing on the learning of hard-to-classify samples. The formula is as follows:
$$Focal~Loss= – {alpha _t}{left( {1 – {p_t}} right)^gamma }log left( {{p_t}} right)$$
(1)
Where, Pt is the model’s predicted probability for the correct class, γ is the modulation parameter that controls the suppression of easy samples, and αt is a balancing factor that addresses class imbalance. Focal Loss increases the loss weight for hard-to-classify samples, promoting more effective learning of their features, which enhances classification accuracy.
Dice Loss is a similarity-based loss function that uses the Dice coefficient to measure the overlap between two sample sets. It maximizes the overlap between the predicted result and the ground truth to improve the segmentation performance. The formula is:
$$Dice~Loss=1 – frac{{2sumnolimits_{{i=1}}^{N} {{p_i}{g_i}} }}{{sumnolimits_{{i=1}}^{N} {p_{i}^{2}+sumnolimits_{{i=1}}^{N} {g_{i}^{2}} } }}$$
(2)
Where, Pi and gi represent the predicted and ground truth pixel values, respectively. Dice Loss has significant advantages in handling small targets or minority classes, as it emphasizes the matching of target regions rather than the absolute number of pixels. By combining Focal Loss and Dice Loss, the model’s robustness and accuracy in semantic segmentation tasks are significantly improved, particularly in handling class imbalance and small target recognition.
DRL-Watershed algorithm
The watershed algorithm, based on topological theory, is widely used for edge detection and image segmentation tasks25. The core idea of this algorithm is to treat an image as a topographical surface and simulate water flow from local minima, expanding outward to identify the boundaries between different “valleys.” However, in leaf segmentation tasks, the watershed algorithm can be susceptible to noise, which may result in poor boundary identification. To address this issue, this paper combines the watershed algorithm with preprocessing steps, such as filtering and morphological operations. Additionally, each leaf region is filled with a distinct color to enhance segmentation accuracy, followed by the localization of disease regions within the target areas.
The principles of the DRL-Watershed algorithm are summarized in Table 2. The parameters used for the DRL-Watershed algorithm are summarized in Table 3.
Full size table
Full size table
Experimental setup
The experimental setup is summarized in Table 4.
Full size table
Evaluation metrics
The evaluation metrics used in this study include the mean Intersection over Union (mIoU), pixel accuracy (PA), mean pixel accuracy (mPA), and confusion matrix.
In semantic segmentation, Intersection over Union (IoU) represents the ratio of the intersection to the union of the ground truth and predicted values for each class. mIoU is an average metric used to evaluate the mean IoU across all categories in a dataset. It is calculated by determining the ratio of true values to predicted values for each class and averaging these ratios across all classes. The formula is as follows:
$${text{mIoU}}=frac{1}{{text{k}}}mathop sum limits_{{i=1}}^{k} frac{{T{P_i}}}{{T{P_i}+F{P_i}+F{N_i}}}$$
(3)
Where, k is the total number of classes, and TPi, FPi, FNi refer to true positives, false positives, and false negatives for class i, respectively.
Pixel accuracy (PA) is used to measure prediction accuracy, calculated as follows:
$${text{PA}}=frac{{sumnolimits_{{i=1}}^{k} {{p_{ii}}} }}{{sumnolimits_{{i=1}}^{k} {sumnolimits_{{j=1}}^{k} {{p_{ij}}} } }}$$
(4)
Where, Pii represents the number of correctly predicted pixels for class i, and Pij is the total number of pixels in class i.
Mean pixel accuracy (mPA) assesses the percentage of correctly classified pixels for each category and averages these across all classes. The formula is:
$${text{mPA}}=frac{1}{{k+1}}mathop sum limits_{{i=0}}^{k} frac{{{p_{ii}}}}{{sumnolimits_{{j=0}}^{k} {{p_{ij}}} }}$$
(5)
Where, k is the total number of classes and Pii and Pij represent the correctly predicted pixels and total pixels in class i, respectively.
The confusion matrix displays the correspondence between predicted and true labels for disease severity classification. It is calculated as follows:
$$Confusion~Matrix=left( {begin{array}{*{20}{c}} {TP}&{FP} \ {FN}&{TN} end{array}} right)$$
(6)
$$A{text{cc}}uracy=frac{{TP+TN}}{{TP+TN+FP+FN}}$$
(7)
Where, TP is the number of true positives (samples correctly classified as positive), TN is the number of true negatives (samples correctly classified as negative), FP is the number of false positives (samples incorrectly classified as positive), and FN is the number of false negatives (samples incorrectly classified as negative).
Results
The experimental process
To enhance the model’s generalization ability and convergence speed, pretrained backbone network parameters were used. During training, the input image size was set to 480 × 480, and the number of epochs was adjusted to 100. The optimal combination of hyperparameters and the best optimization algorithm were selected to ensure the model could effectively learn a sufficient number of features. The Adam optimizer was used for all models, with an initial learning rate of 0.001. If the loss showed little variation, the learning rate was reduced by 50%.
Table 5 indicates that the selection of hyperparameters significantly affects the segmentation performance of the HRNet model in apple leaf disease segmentation tasks.
Full size table
The performance of the HRNet model demonstrates remarkable stability across different hyperparameter settings, with minimal variations in evaluation metrics. The results indicate that HRNet is relatively stable when applied to the apple leaf disease segmentation task. The optimal segmentation performance is achieved when the learning rate is set to 0.0001 and the Adam batch size is 8.
To evaluate the segmentation performance of the Improved HRNet model for four types of apple leaf diseases, a comparison with the original HRNet model was made. Figure 7 compares the performance of HRNet and Improved HRNet in terms of IoU and PA for four diseases: Alternaria Blotch, Brown Spot, Grey Spot, and Rust.

Comparison of Segmentation Performance between HRNet and Improved HRNet
Full size image
The results show that, compared to HRNet, the Improved HRNet significantly improved in the Alternaria Blotch segmentation task, with an 11.54% point increase in IoU and a 7.98% point increase in PA. In the Brown Spot segmentation task, IoU increased by 1.5% points and PA by 0.38% points. In the Grey Spot segmentation task, IoU increased by 9.14% points and PA by 2.6% points. However, in the Rust segmentation task, IoU increased by 2.71% points and PA by 0.65% points. These results indicate that the introduction of the NAM attention mechanism in the Improved HRNet model enhances the focus on local features of the lesions, improving the effectiveness of feature extraction and, consequently, the segmentation accuracy. On the other hand, the Brown Spot and Rust diseases have more distinctive features, so HRNet already performed well in these categories, resulting in a smaller improvement in the Improved HRNet model for these tasks.
Comparison of different backbone networks
This study improved the HRNet model by testing three different backbone network widths: HRNet_w18, HRNet_w32, and HRNet_w48, to compare their performance in apple leaf disease segmentation. Figures 8(a) and 8(b) present the training results for apple leaf disease image segmentation using models with different backbone network widths. The experimental results are shown in Table 6.

(a)Loss value change curve; (b) mIoU value change curve
Full size image
Full size table
The results show that HRNet_w32 provides the best overall performance. Its average IoU (mIoU) is 82.21%, which is an improvement of 2.07% points over HRNet_w18 and 0.07% points over HRNet_w48. The average pixel accuracy (mPA) is 89.59%, which is an improvement of 2.71% points over HRNet_w18 and 0.97% points over HRNet_w48. Additionally, its average precision (mPrecision) reaches 89.53%. While HRNet_w48 achieves the highest precision of 91.92%, the improvements in mIoU and mPA are marginal. This is likely due to the excessively large network width of HRNet_w48, which leads to overfitting during training and causes a performance bottleneck on the test set. Furthermore, the larger network increases computational complexity and cost, resulting in slightly underwhelming performance in terms of mIoU and mPA. Overall, HRNet_w32 strikes an optimal balance between performance and computational complexity, avoiding the overfitting issue observed with HRNet_w48 while delivering a solid segmentation performance. Therefore, HRNet_w32 is selected as the backbone network for apple leaf disease segmentation tasks.
Comparison of different attention mechanisms
To analyze the performance of different attention mechanisms in the apple leaf disease segmentation task, we conducted comparative experiments using CBAM, SENet, and NAM attention mechanisms. In each experiment, the attention module was added at the same position in the encoder. Figures 9(a) and 9(b) display the training outcomes for models with various attention mechanisms applied to apple leaf disease image segmentation. The experimental results are presented in Table 7.

(a)Loss value change curve; (b) mIoU value change curve
Full size image
Full size table
As shown in the table, when the SENet module was added, the mIoU increased by 0.4%, reaching 85.22%. With the addition of the CBAM module, mIoU improved by 2.54%, reaching 87.36%. The introduction of the NAM module resulted in the highest increase of 3.51%, with an mIoU of 88.33%. This demonstrates that NAM outperforms the other attention modules in terms of segmentation accuracy. NAM enhances the model’s ability to learn apple leaf disease features by effectively weighting multi-source information and reducing the interference of background noise and redundancy. Furthermore, during the feature fusion process across different resolutions, NAM improves the quality of multi-scale feature integration, thereby enhancing overall segmentation performance. Compared to CBAM and SENet, NAM exhibits superior capability in capturing local details, suppressing background noise, and adapting to multi-scale features, which significantly boosts the model’s segmentation performance. In apple leaf disease segmentation tasks, the NAM attention mechanism proves to be the most suitable choice.
Performance analysis of ablation experiment
To systematically evaluate the impact of each module on the overall model performance, we designed four ablation experiments. These experiments assess the effects of replacing the backbone network, adding the attention mechanism, and using Focal Loss and Dice Loss functions. The experimental results are summarized in Table 8.
Full size table
The table shows that using HRNet_w32 as the backbone network significantly improved segmentation performance, with mIoU and mPA increasing by 4.68 and 5.22% points, respectively. The introduction of the NAM attention mechanism further boosted mIoU and mPA by 3.51 and 1% point, respectively, due to NAM’s enhancement in the multi-scale feature fusion process, which better refines features across different resolutions. The use of Focal Loss effectively addressed the issue of class imbalance, improving mIoU and mPA by 0.47 and 0.17% points, respectively. Dice Loss enhanced segmentation accuracy for small targets and imbalanced classes, with mIoU and mPA increasing by 0.55 and 0.21% points, respectively.
When HRNet_w32, NAM attention mechanism, Focal Loss, and Dice Loss were combined, the model achieved the highest performance, with mIoU and mPA improving by 8.77 and 7.25% points, respectively. This significantly enhanced the model’s segmentation performance for apple leaf disease.
Comparison with other segmentation methods
To further validate the segmentation performance of the improved HRNet model, we compared it with several classic semantic segmentation models commonly used for plant disease tasks, including DeeplabV3 +[26] , U-Net27and PSPNet28. The results are presented in Fig. 10.

Comparison Results of Different Models
Full size image
As shown in Fig. 9, the proposed model outperforms the others in disease segmentation, achieving the best accuracy with an mIoU of 88.91% and an mPA of 94.13%. The DeeplabV3 + model performed the worst, with an mIoU of 79.20% and an mPA of 87.35%. The U-Net model showed relatively superior segmentation performance, with an mIoU of 80.85% and an mPA of 86.38%. The PSPNet model had an mIoU of 79.71% and an mPA of 87.86%. The experimental results indicate that the NAM attention mechanism incorporated into HRNet enhances the model’s feature extraction and representation abilities. Additionally, the optimization of the loss functions im-proves the model’s segmentation accuracy for diseased areas and addresses the seg-mentation accuracy issues caused by data sample imbalance during training. Overall, the HRNet model, with its high-resolution feature representation, is better suited to the requirements of apple leaf disease segmentation tasks.
This study visualized the segmentation results of five algorithms: Improved HRNet, HRNet, DeeplabV3+, U-Net, and PSPNet, as shown in Fig. 11.

Comparison of segmentation effects
Full size image
Figure 11 reveals distinct performance variations among models in disease segmentation tasks. The morphological and chromatic similarity between Alternaria Blotch and Grey spot lesions induced misclassification errors in Models C, D, and E, which erroneously identified Alternaria Blotch as Grey spot. These models also demonstrated inadequate precision in segmenting overlapping healthy leaf regions. In Brown Spot segmentation, Models D and E showed minor false positives, while Models B, C, and E suffered significant under-segmentation issues. Grey spot detection revealed two critical failures: Models D and E produced misclassifications, Models B, D, and E generated oversimplified healthy tissue delineation, and Model C even segmented non-existent targets. For Rust identification, Model E exhibited false positives, while Models B-D displayed insufficient resolution in overlapping healthy leaf areas.
Notably, the Improved HRNet achieved accurate four-disease differentiation with exceptional edge delineation and complete lesion morphology while achieving pixel-level precision at disease-leaf boundaries. This architecture demonstrated superior robustness and segmentation accuracy through its hierarchical feature integration mechanism, effectively addressing the critical challenges of inter-class similarity and complex edge topology that compromised conventional models.
Assessment of disease severity levels
To accurately assess the severity of apple leaf diseases, this study refers to the local standard of Shanxi Province, “DB14/T 143–2019 Apple Brown Spot Disease Monitoring and Survey Guidelines,” to establish grading parameters for apple brown spot disease. Based on pixel statistics, Python was used to calculate the pixel count of the diseased and healthy leaf areas. The leaf disease severity was classified into six levels: Level 0 (healthy leaf), Level 1, Level 3, Level 5, Level 7, and Level 9. The detailed leaf disease grading standards are shown in Table 9.
Full size table
Where, represents the ratio of the diseased area to the area of a single leaf, and is calculated using the following formula:
$${text{k}}=frac{{{A_{scab}}}}{{{A_{leaf}}}}=frac{{sumnolimits_{{(x,y) in scab}} {pixel(x,y)} }}{{sumnolimits_{{(x,y) in leaf}} {pixel(x,y)} }}$$
(8)
In the formula, Ascab denotes the area of the diseased region, Aleaf represents the area of a single leaf, and pixel(x, y) is used to count the number of pixels corresponding to the diseased and leaf regions, respectively.
In the process of grading apple leaf diseases in complex backgrounds, the diversity of leaf shapes and the complexity of the background affect pixel statistics, which in turn influences the grading results. To address this, pixel statistical analyses were performed under three scenarios: a single leaf, separated multiple leaves, and overlapping multiple leaves. The DRL-Watershed algorithm was used to accurately count the pixels of the disease and the leaf area in each scenario, ensuring the accuracy of the grading results. The visualized segmentation results of the DRL-Watershed algorithm for the three cases are shown in Fig. 12:

Visualization of DRL-Watershed Algorithm Results
Full size image
Pixel statistical analysis for a single leaf
To verify the effectiveness of the DRL-Watershed algorithm in pixel counting for a single leaf, a comparative experiment was conducted using the pixel statistics from the improved HRNet model. The grading results for disease severity on a single leaf are shown in Table 10.
Full size table
As shown in Table 10, for the improved HRNet model, the total number of pixels in the leaf area (sum of leaf and disease pixels) is 127,917, with the disease occupying 46% of the area, resulting in a disease level of Level 9. In the DRL-Watershed algorithm, the number of leaf pixels is 126,026, with the disease area occupying 47%, and the disease level is also Level 9. This demonstrates that both the Improved HRNet model and the DRL-Watershed algorithm were able to accurately count the leaf pixels and calculate the disease proportion, yielding corresponding disease severity levels.
Pixel statistical analysis for separated multiple leaves
The principle of using the watershed algorithm for handling multi-leaf separation in disease severity assessment is illustrated in Fig. 13. To assess the performance of the DRL-Watershed algorithm for scenarios with multiple separated leaves, pixel statistics were compared with the results from the improved HRNet model. The disease severity grading results for the separated leaves are shown in Table 11.

Example of the principle of the watershed algorithm
Full size image
Full size table
As shown in Table 11, the improved HRNet model calculates the disease-to-leaf pixel ratio across the entire image, resulting in a disease proportion of 18.22% and a disease level of Level 5, which reduces the overall disease proportion and severity. In contrast, the DRL-Watershed algorithm separately counts the pixels for each individual leaf and computes the disease ratio for each leaf, providing a more accurate reflection of the disease severity. For example, the DRL-Watershed algorithm calculates that the disease proportion for Leaf Area 2 is 26.26%, corresponding to a disease level of Level 7, which accurately represents the disease severity on each leaf and offers a more precise grading assessment.
Pixel statistical analysis for overlapping multiple leaves
Similarly, the principle of applying the watershed algorithm for assessing disease severity in overlapping multi-leaf scenarios is demonstrated in Fig. 14. To evaluate the DRL-Watershed algorithm’s performance for scenarios with overlapping leaves, a comparative experiment was performed using pixel statistics from the improved HRNet model. The disease grading results for the overlapping multiple leaves are shown in Table 12.

Example of the principle of the watershed algorithm
Full size image
Full size table
As shown in Table 12, the improved HRNet model calculates the disease-to-total-leaf pixel ratio, yielding a disease proportion of 24% and a corresponding disease level of Level 5. This method results in an underestimation of the disease severity because the disease pixels are compared to the total leaf area across all leaves. However, the DRL-Watershed algorithm effectively segments the overlapping leaf regions, allowing it to calculate the pixel count for each individual leaf. In the two overlapping areas, the DRL-Watershed algorithm calculates the disease proportion for Area 1 as 32%, with a corresponding disease level of Level 7, and for Area 2 as 22%, corresponding to Level 5. This approach provides a more accurate reflection of the disease severity in each overlapping leaf region, yielding a grading assessment closer to the actual situation.
Severity grading statistical analysis
In this study, the performance of the HRNet model and the DRL-Watershed algorithm in grading apple leaf diseases on the test set was evaluated and analyzed using confusion matrices. The true severity levels were determined based on the ratio of the disease area to the leaf area during the data annotation process. Figure 15 compares the predicted results of the improved HRNet model with the true results, and the disease severity evaluation results of the DRL-Watershed algorithm on the same test set, respectively. The vertical axis represents the true labels, while the horizontal axis represents the model’s predictions. Each cell in the matrix contains the number of samples where a true category was predicted as a specific category. Higher values in the diagonal blocks indicate that the model correctly predicted the disease severity levels. The diagonal elements of the confusion matrix represent the number of correctly classified samples, while the off-diagonal elements represent misclassifications. The intensity of the diagonal color corresponds to the accuracy of the grading for each level.

Disease severity confusion matrix. (a) Confusion Matrix for Grading Evaluation of the Improved HRNet Model.; (b) Confusion Matrix for Grading Evaluation of the DRL-Watershed Algorithm
Full size image
In the confusion matrix of the HRNet model, 89 samples were correctly classified as Level 1. For Level 3, 21 samples were misclassified as Level 1, while 36 samples were correctly classified as Level 3. In Level 5, 2 samples were misclassified as Level 3, but most samples were correctly classified as Level 5. Levels 7 and 9 exhibited some classification confusion, particularly with samples from Level 7 being misclassified as either Level 5 or Level 9. The HRNet model demonstrates high accuracy in predicting lower disease severity levels. However, there is some error in predicting higher severity levels, which can be attributed to the HRNet model’s tendency to underestimate disease severity in multi-leaf scenarios. This occurs because the HRNet model does not distinguish between individual leaves when processing multiple leaves, leading to lower predicted severity levels compared to the actual severity.
The confusion matrix for the DRL-Watershed algorithm shows significant improvements, particularly for Level 3. In the 55 samples for Level 3, only 2 were misclassified as Level 1, with the rest correctly classified as Level 3. Classification accuracy for Level 5 also improved, with 31 samples correctly classified and only 1 misclassified as Level 3. For Level 9, all 13 samples were correctly classified. Compared to Figure a, the classification results for Level 7 were notably better, with 8 samples correctly classified and no significant misclassifications. These results suggest that the DRL-Watershed algorithm, by separately analyzing the disease proportion in each leaf region, provides a more accurate assessment of disease severity, especially in complex and overlapping leaf scenarios.
In the confusion matrix for the DRL-Watershed algorithm, two Level 3 samples were misclassified as Level 1, one Level 5 sample as Level 3, and one Level 9 sample as Level 3. These errors may be caused by noise introduced by lighting, shadows, or other environmental factors, which result in unclear boundaries in the overlapping leaf regions. In these regions, the gradients are less pronounced, leading to inaccurate seg-mentation of the leaf area, which in turn affects the final disease severity predictions.
Discussion
The detection and statistical analysis of apple leaf diseases are crucial for orchard health management. They provide timely indicators of disease severity, enabling precise pest control measures that effectively reduce the impact of diseases on fruit quality and yield. In research on apple leaf disease severity assessment, Xing et al.29 developed an apple leaf disease grading model using PCA-logistic regression analysis, achieving an average accuracy of 90.12%. Lu et al.30 employed the MixSeg semantic segmentation model to segment apple leaves and diseases in complex environments, achieving IoU scores of 98.22% and 98.09% for leaf segmentation, and 87.40% and 86.20% for disease segmentation. These studies primarily focus on individual leaf segmentation, neglecting the complexities of real orchard conditions. Therefore, this study is based on a dataset of apple leaf images from real-world orchard settings and proposes an improved HRNet segmentation model combined with a DRL-watershed algorithm. This approach enables accurate segmentation of multiple leaves and overlapping disease regions in the complex background of actual orchard environments, along with efficient disease severity assessment. It provides a theoretical foundation for low-cost, high-precision disease severity quantification, offering scientific support for disease management and control in apple orchards.
The proposed improved HRNet segmentation model achieves an average intersection-over-union (mIoU) of 88.91% and an average pixel accuracy (mPA) of 94.13%. Although this mIoU is slightly lower than the 98.22% IoU reported by Lu et al. for leaf segmentation, it is important to note that their work focuses on segmenting individual apple leaves under relatively controlled backgrounds. In contrast, our model is designed for real-world orchard environments where leaves often appear in clusters with occlusions, overlaps, and complex background interference. This inevitably introduces greater segmentation challenges and may reduce overall IoU, but it significantly enhances the model’s robustness and applicability in practical scenarios. Therefore, the slightly lower mIoU is a trade-off for improved adaptability and generalization in more realistic and complex conditions. Meanwhile, the DRL-watershed algorithm yields a classification accuracy of 97.65% for disease severity assessment. These results demonstrate the model’s capability to accurately segment and evaluate apple leaf diseases in real orchard environments. However, during the study, it was observed that factors such as leaf overlap, angular variations, and complex backgrounds may introduce segmentation errors, affecting the accurate assignment of leaf regions and severity assessments. Future work will focus on integrating additional spatial information and directional features to improve the model’s adaptability to leaf pose variations. Efforts will also be directed towards reducing the computational complexity of the model, optimizing the training process, and implementing acceleration on hardware platforms to meet real-time requirements in practical applications. This will enable more efficient disease detection and evaluation in complex environments.
Conclusions
This paper presents an apple leaf and disease segmentation method that combines an improved HRNet and DRL-Watershed algorithm for assessing disease severity in real-world orchard environments. First, the HRNet_w32 with moderate network width, which yields optimal segmentation performance, is selected as the backbone network. The NAM attention mechanism is incorporated in the encoder to enhance the model’s feature extraction capabilities. Additionally, both Dice Loss and Focal Loss functions are jointly employed to improve the accuracy of lesion area segmentation. To further refine the segmentation results, the DRL-Watershed algorithm is applied to precisely separate overlapping leaves in real-world scenarios, clearly delineating the boundaries of each leaf and providing a more accurate assessment of disease severity for each individual leaf.
The improved HRNet model outperforms the original HRNet model, achieving a 7.25% increase in mean pixel accuracy (mPA) and an 8.77% increase in mean intersection-over-union (mIoU). This enhancement enables effective segmentation of both apple leaf and disease areas. The DRL-watershed algorithm achieves an overall classification accuracy of 97.65%, demonstrating its ability to accurately distinguish overlapping leaves in real-world scenarios. This improvement strengthens the model’s adaptability and reliability in multi-leaf scenarios, accurately counting the pixel number in each leaf region. Consequently, it enhances the authenticity and effectiveness of disease severity assessment, providing more precise information support for disease management and control.
Data availability
This dataset is currently being used for ongoing research and is therefore not publicly available. However, the data are available from the corresponding author upon reasonable request.
References
-
Bi, C. et al. MobileNet based Apple leaf diseases identification. Mob. Netw. Appl. 27, 172–180 (2020).
Google Scholar
-
Jung, K. H. Growth Inhibition effect of pyroligneous acid on pathogenic fungus, alternaria mali, the agent of alternaria blotch of Apple. Biotechnol. Bioprocess. Eng. 12, 318–322 (2007).
CAS Google Scholar
-
Zhang, S., Zhang, Y., Liu, H. & Han, J. Isolation of alternaria Mali Roberts and its sensitivities to four fungicides. J. Shanxi Agric. Univ. 24, 382–384 (2004).
Google Scholar
-
Bock, C. H., Poole, G. H., Parker, P. E. & Gottwald, T. R. Plant disease severity estimated visually, by digital photography and image analysis, and by hyperspectral imaging. Crit. Rev. Plant. Sci. 29, 59–107. https://doi.org/10.1080/07352681003617285 (2010).
Article Google Scholar
-
Li, K., Zhang, L., Li, B., Li, S. & Ma, J. Attention-optimized deeplab V3 + for automatic Estimation of cucumber disease severity. Plant. Methods. 18, 109 (2022).
CAS PubMed PubMed Central Google Scholar
-
Su, W. H. et al. Hyperspectral imaging and improved feature variable selection for automated determination of Deoxynivalenol in various genetic lines of barley kernels for resistance screening. Food Chem. 343, 128507 (2021).
CAS PubMed Google Scholar
-
Pan, T., Chyngyz, E., Sun, D. W., Paliwal, J. & Pu, H. Pathogenetic process monitoring and early detection of Pear black spot disease caused by alternaria alternata using hyperspectral imaging. Postharvest Biol. Technol. 154, 96–104 (2019).
Google Scholar
-
Appeltans, S., Pieters, J. G. & Mouazen, A. M. Detection of Leek white tip disease under field conditions using hyperspectral proximal sensing and supervised machine learning. Comput. Electron. Agric. 190, 106453 (2021).
Google Scholar
-
Singh, V. Sunflower leaf diseases detection using image segmentation based on particle swarm optimization. Artif. Intell. Agric. 3, 62–68 (2019).
Google Scholar
-
Chaudhary, P., Chaudhari, A. K., Cheeran, A. & Godara, S. Color transform based approach for disease spot detection on plant leaf. Int. J. Comput. Sci. Telecommun. 3, 65–70 (2012).
Google Scholar
-
Jothiaruna, N., Sundar, K. J. A. & Karthikeyan, B. A segmentation method for disease spot images incorporating chrominance in comprehensive color feature and region growing. Comput. Electron. Agric. 165, 104934 (2019).
Google Scholar
-
Gargade, A. & Khandekar, S. Custard Apple leaf parameter analysis, leaf diseases, and nutritional deficiencies detection using machine learning. In: Merchant, S.N., Warhade, K., Adhikari, D. (eds) Advances in Signal and Data Processing. 57–74 (2021).
Google Scholar
-
Jiang, Q., Wang, H. & Wang, H. Severity assessment of wheat Stripe rust based on machine learning. Front. Plant Sci. 14, 1664–462X (2023).
Google Scholar
-
Li, G. L., Ma, Z. H. & Wang, H. G. An automatic grading method of severity of single leaf infected with grape downy mildew based on image processing. J. China Agric. Univ. 16, 88–93. https://doi.org/10.11841/j.issn.1007-4333.2011.06.014 (2011).
Article Google Scholar
-
Wang, C. et al. A cucumber leaf disease severity classification method based on the fusion of DeepLabV3 + and U-Net. Comput. Electron. Agric. 189, 106373. https://doi.org/10.1016/j.compag.2021.106373 (2021). ISSN 0168–1699.
Article Google Scholar
-
Khan, K., Khan, R. U., Albattah, W. & Qamar, A. M. End-to-End Semantic Leaf Segmentation Framework for Plants Disease Classification. Complexity 2022, 1168700. (2022).
-
Wu, P. et al. Sweetgum leaf spot image segmentation and grading detection based on an improved DeeplabV3 + Network. Forests 14, 1547. https://doi.org/10.3390/f14081547 (2023).
Article Google Scholar
-
Baliyan, A., Kukreja, V., Salonki, V. & Kaswan, K. S. Detection of Corn Gray Leaf Spot Severity Levels using Deep Learning Approach. In Proceedings of the 2021 9th International Conference on Reliability, Infocom Technologies and Optimization (Trends and Future Directions) (ICRITO), Noida, India, 3–4 September ; pp. 1–5. (2021).
-
Ji, M. & Wu, Z. Automatic detection and severity analysis of grape black measles disease based on deep learning and fuzzy logic. Comput. Electron. Agric. 193, 106718 (2022).
Google Scholar
-
Liu, B. Y., Fan, K. J., Su, W. H. & Peng, Y. Two-Stage convolutional neural networks for diagnosing the severity of alternaria leaf blotch disease of the Apple tree. Remote Sens. 14, 2519. https://doi.org/10.3390/rs14112519 (2022).
Article CAS Google Scholar
-
Liu, B. et al. Tomato leaf disease recognition based on multi-task distillation learning. Frontiers in Plant Science. 14, ISSN = 1664-462X, DOI = 10.3389/fpls.2023.1330527. (2024).
-
Xu, Y. et al. Two-Stage Approach To the Study of Potato Disease Severity Classification14386 (Agriculture, 2024). https://doi.org/10.3390/agriculture14030386
-
Yao, H. et al. Cucumber leaf disease severity grading method in natural environment based on the fusion of TRNet and U-Net. Agronomy 14, 72. https://doi.org/10.3390/agronomy14010072 (2024).
Article Google Scholar
-
Wang, J., Sun, K., Xiao, B. & Liu, D. Deep High-Resolution Representation Learning for Human Pose Estimation. Proceedings of the IEEE/CVF Conference on Computer Vision and Pattern Recognition (CVPR), pp. 5693–5703 (2019).
-
Min, B. Raquel Urtasun; Deep Watershed Transform for Instance Segmentation; Proceedings of the IEEE Conference on Computer Vision and Pattern Recognition (CVPR), pp. 5221–5229 (2017).
-
Chen, L-C., Zhu, Y., Papandreou, G., Schroff, F. & Adam, H. Encoder-Decoder with Atrous Separable Convolution for Semantic Image Segmentation; Proceedings of the European Conference on Computer Vision (ECCV), pp. 801–818 (2018).
-
Ronneberger, O., Fischer, P. & Brox, H. U-Net: Convolutional Networks for Biomedical Image Segmentation; Medical Image Computing and Computer-pp. 234–241 (Assisted Intervention – MICCAI, 2015).
-
Zhao, H-S., Shi, J-P., Qi, X-J., Wang, X-G. & Jia, J-Y. Pyramid Scene Parsing Network; Proceedings of the IEEE Conference on Computer Vision and Pattern Recognition (CVPR), pp. 2881–2890 (2017).
-
Xing, B., Wang, D. & Yin, T. The evaluation of the grade of leaf disease in Apple trees based on PCA-Logistic regression analysis. Forests 14, 1290. https://doi.org/10.3390/f14071290 (2023).
Article Google Scholar
-
Lu, B., Lu, J., Xu, X. & Jin, Y. MixSeg: a lightweight and accurate mix structure network for semantic segmentation of Apple leaf disease in complex environments. Front. Plant Sci. 14, 1664–1462. https://doi.org/10.3389/fpls.2023.1233241 (2023). X.
Article Google Scholar
Download references
Funding
This research was funded by the Shanxi Provincial Key Research and Development Project, grant number 202202140601021, the Shanxi Agricultural University Innovation and Entrepreneurship Education Research Project, grant number 2024Y06, and the 2025 “Special” and “Excellent” Agricultural High-Quality Development Science and Technology Support Project, grant number TYGC25-42.
Ethics declarations
Competing interests
The authors declare no competing interests.
Additional information
Publisher’s note
Springer Nature remains neutral with regard to jurisdictional claims in published maps and institutional affiliations.
Rights and permissions
Open Access This article is licensed under a Creative Commons Attribution-NonCommercial-NoDerivatives 4.0 International License, which permits any non-commercial use, sharing, distribution and reproduction in any medium or format, as long as you give appropriate credit to the original author(s) and the source, provide a link to the Creative Commons licence, and indicate if you modified the licensed material. You do not have permission under this licence to share adapted material derived from this article or parts of it. The images or other third party material in this article are included in the article’s Creative Commons licence, unless indicated otherwise in a credit line to the material. If material is not included in the article’s Creative Commons licence and your intended use is not permitted by statutory regulation or exceeds the permitted use, you will need to obtain permission directly from the copyright holder. To view a copy of this licence, visit http://creativecommons.org/licenses/by-nc-nd/4.0/.
Reprints and permissions
About this article

Cite this article
Bi, Z., Ma, F., Guan, J. et al. Apple leaf disease severity grading based on deep learning and the DRL-Watershed algorithm. Sci Rep 15, 30071 (2025). https://doi.org/10.1038/s41598-025-15246-8
Download citation
-
Received:
-
Accepted:
-
Published:
-
DOI: https://doi.org/10.1038/s41598-025-15246-8
Keywords
Related Posts