Ultimately, he and his group want to help people design more accurate and robust deep-learning models that are better suited for their intended application. “We used to debug systems just by looking at their parameters and figuring out whether they make sense or not. Now, we need ‘mind-reading tools’ that can take this really complicated
Next-generation Power HyD detectors and AI Denoise enable faster, photon-efficient quantitative imaging
- PARTNER CONTENT Partner retains sole responsibility for the content of this article
Produced by

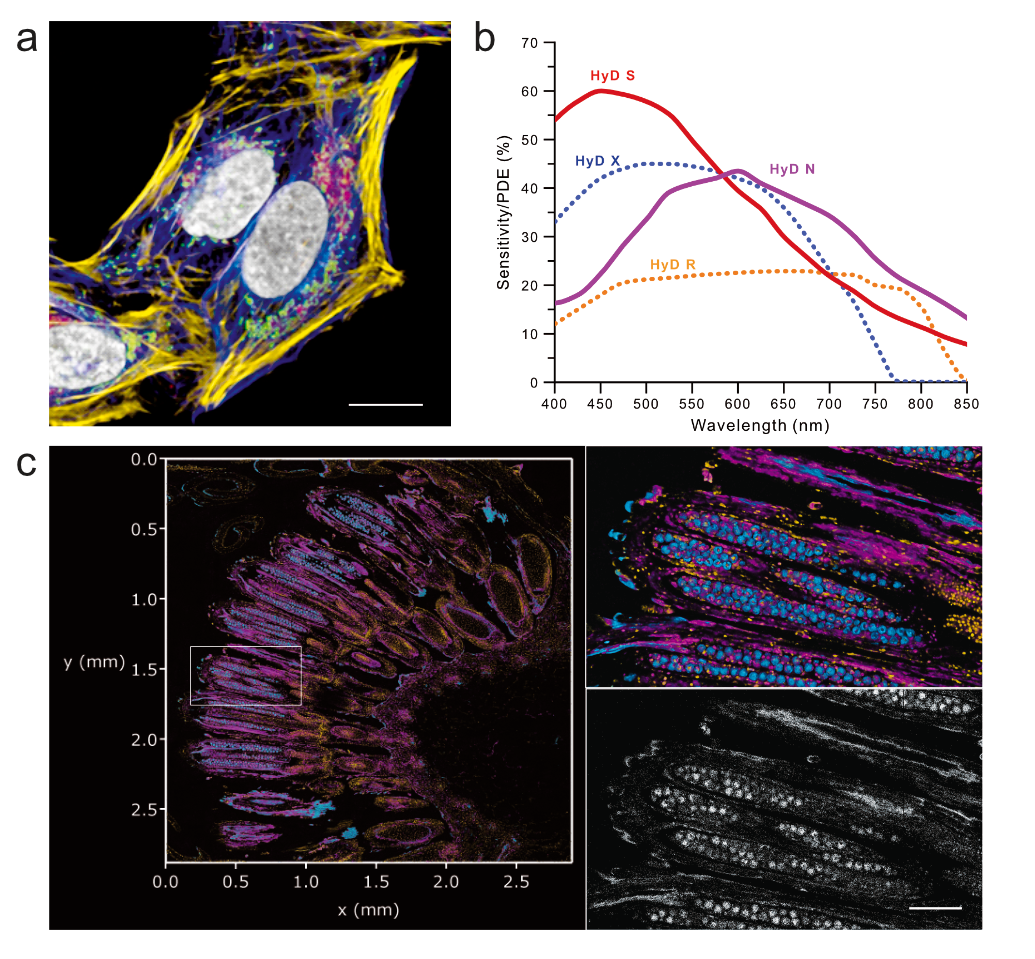
The continuous expansion of biologically compatible fluorescent probes is driving confocal microscopy beyond the visible spectrum into the near-infrared (NIR) region, calling for new detection concepts to maximize photon collection. In 2020, STELLARIS introduced the Power HyD S detector1, the first silicon multi-pixel photon counter (MPPC) engineered for high-end imaging, enabling both analogue and photon counting imaging. We now introduce a new generation of MPPC-based detectors, including a far-red shifted variant, namely the Power HyD N, with enhanced photodetection efficiency (PDE) complementing the STELLARIS White Light Laser excitation (up to 790 nm) for effortless imaging of multiple NIR fluorophores in a single sample (Fig. 1a, b).
The new detectors benefit from redesigned electronics and cooling that bring them to an operating temperature of -39°C, lowering dark count rates for an even more reliable detection of single photon events. Coupled with PowerCounting1, which resolves overlapping photon events that conventional photon-counting misses, the Power HyD architecture extends the quantitative regime of photon-resolved imaging. This flexibility across the spectral range (Fig. 1a, b) at low dark count rates benefits dim and sparsely labelled samples, such as endogenous tags or fast resonant scanner acquisitions. Importantly, both detectors retain the lifetime-based imaging capabilities of the previous generation2 (Fig. 1c).

Figure 1| (a) STELLARIS standard 5-colour sample showcasing 3 NIR fluorescent labels and imaged with next-generation Power HyD detectors: SytoxGreen DNA (greyscale, HyD S); Mitotracker Red (green, HyD X); SIR-700 Actin (yellow, HyD N); AF750 Tom20 (magenta, HyD N) and AF790 Tubulin (blue, HyD N), scale bar = 5 µm). (b) PDE vs. detection wavelength. (c) Bellis perennis L. (Asteraceae) volume acquired with a single Power HyD N, and lifetime-based separation of three biologically distinct components. Left: AI Denoise volume (2.8mm x 2.8 mm x 21 µm). Total imaging time: 6 min. Scale bar 100 µm. Right: AI Denoise detail (top), and raw data (bottom).
While these innovations maximize photon collection efficiency, the photon budget in many biologically relevant experiments remains intrinsically limited by the characteristics of the sample and the process under study. Typical examples come from live imaging of highly dynamic processes over an extended multi-colour palette, high acquisition speeds and very gentle excitation that brings signals to close-to-noise levels. AI-based image denoising has recently become a powerful option to extract meaningful results from photon-limited experiments3,4,5,6,7,8,9,10. To extend the application range in highly photon-starved conditions, we developed an approach that takes the photon readout and applies an on-the-fly AI-based denoising. This implementation, named AI Denoise, builds our own Convolutional Neuronal Network (CNN) framework on the Noise2Noise approach3, previously shown to work on confocal images7. AI Denoise operates on-the-fly during live scanning, across different imaging acquisition modes (2D, 3D, time series), and keeping the raw data. CNN denoising also works as a post-processing tool.
We trained the network on our own data to capture the physical response from our digital detectors (Fig. 2). For time series, we trained on seven adjacent images and leveraged the extra information to stabilize the noise response across the data (Fig. 2a), keeping signal fluctuations consistent between raw and AI Denoise data. AI Denoise also preserves signal linearity and scales with the raw data better than previous Noise2Noise implementations: on a wedge image with added Poisson noise, the results follow the noise variations more closely and stay consistent with the raw data (Fig. 2b).
As with any neuronal network, insufficient input data raises the risk of artefacts. To prevent this, we implemented a hallucination blocker. When an image holds too few photons for a faithful interpretation, AI Denoise blurs those no-information regions instead of generating detail out of nothing (Fig. 2c). As explained above, AI Denoise delivers robust results at lower signal levels when time-series information is available, and the hallucination blocker triggers at a lower signal-to-noise than for a single image. These optimizations make AI Denoise well suited for cellular segmentation at varying noise levels (Fig 2d).

Figure 2 | (a) AI Denoise in time series. For live acquisitions, the CNN runs at reduced computational load for on-the-fly performance; post-processing uses the full network. (b) AI Denoise linearity. Ramp pattern (0–500 a.u.) with added photon noise. AI Denoise (red) tracks the true values better than ImageJ Noise2Noise (blue). Traces for ground truth (black); Raw Poisson (grey); ImageJ Noise2Noise (blue); AI Denoise (red). Error from true signal (RMSE, lower is better): 1.78 vs 5.12 (raw 3.61). Deviation from ground truth (PSNR, higher is better): 49.0 vs 39.8 dB. (c) AI Denoise hallucination blocker. Left: noisy two-colour image (raw vs. AI Denoise). Right: too close-to-noise image (raw vs. AI Denoise); the blocker blurs areas with too few photons (white arrows) instead of creating artefacts. (d) Cells segmented from representative image: 10 raw vs. AI Denoise pairs at varying noise; intensities agree closely (dashed line, identity; blue line, linear fit, slope 1.008, R² 0.9988). Bland–Altman of raw vs denoised: mean bias +0.03 % (95 % LoA −0.91 to +0.98 %; solid line, bias; dashed lines, ±1.96 SD; shaded bands, 95 % CIs). Point colour, noise-level index (viridis), tracks individual replicates.
We explored applications for this framework across live-cell and fixed specimens, in both confocal and multiphoton imaging. First, we focused on phagocytosis assays with D. discoideum, a professional phagocyte, and yeast. The dynamics and high photosensitivity of D. discoideum yield images systematically dominated by noise under the extremely low excitation light tolerated (Fig. 3a). In fast volumetric confocal timelapses (250 volumes, 5 min), AI Denoise enabled the observation of macrophage activity, offering an alternative to deep-learning generation of macrophage trajectories, and made resonant scanning usable in practice, interpreting image contrast from photon-starved regimes. Large, fixed specimens pose a similar challenge for a different reason: Fast imaging of whole volumes leaves too little signal to read the structures. AI Denoise delivered on both: as examples, we imaged a 290 x 290 x 207 µm volume of a cleared liver sample in 1min 41s (Fig. 3b), and a 232 x 232 x 256 µm volume of dopaminergic neurons in 22s (Fig. 3c). Across these applications, AI Denoise delivered high image quality at high acquisition speeds. AI Denoise also works on raw data coming from lifetime-based information. The Bellis perennis example (Fig. 1c) showed a maximum of 10 counts and <1 average count for a large Z-stack. The total signal was split to reveal three biological channels using lifetime-based separation. AI Denoise recovered clear structural detail from each channel in low photon budget conditions.

Figure 3 | (a) D. Discoideum (cyan) imaging at extremely gentle light dose (to keep sample viability) produces intrinsically noisy images with yeast (magenta). Image gallery: representative examples of time series (250 volumes at 1.2 s/volume, 8kHz (resonant scanner). Top: raw data; bottom: AI Denoise. Courtesy: Joseph Brzostowski, PhD. (b) Cleared mouse liver section showing nuclei (glow) and blood vessels (cyan). Time series: 290 x 290 x 207 µm, 12kHz resonant scanner, acquisition time: 1min 41s); left: raw data; right: AI Denoise. (c) Multiphoton imaging of dopaminergic neurons (232 x 232 x 256 µm, 8kHz resonant scanner, acquisition time 22 s), left: raw data; right: AI Denoise.
In summary, low-noise Power HyD detection and on-the-fly AI Denoise extend the practical imaging capabilities of STELLARIS, making faster, gentler and more photon-efficient confocal and multiphoton imaging accessible for biologically relevant applications.
Authors
Luis AJ Alvarez, Irmtraud Steinmetz, Ulf Schwarz, James Marr, Zhongxiang Jiang, Holger Birk, Frank Hecht, Giulia Ossato and M. Julia Roberti.
Leica Microsystems CMS GmbH, Am Friedensplatz 3, 68165 Mannheim, Germany
email: ;
This application note was submitted to Nature Custom Media by a commercial organization and has not been peer reviewed. Nature Custom Media takes no responsibility for the accuracy or otherwise of the information provided.
References
-
Schweikhard, V. et al. Nat. Methods (Application Note) (2020)
Article Google Scholar
-
Roberti, M.J. et al. Nat. Methods (Application Note) (2020)
Article Google Scholar
-
Lehtinen, J. et al. Proc. 35th Int. Conf. Mach. Learn. 80, 2965-2974 (2018).
Article Google Scholar
-
Krull, A., Buchholz, T.O. & Jug, F. Proc. IEEE/CVF Conf. Comput. Vis. Pattern Recognition.2129-2137 (2019)
Article PubMed Google Scholar
-
Quan, Y., Chen, M., Pang, T. & Ji, H. IEEE/CVF Conf. Comput. Vis. Pattern Recognition., 1890-1898, (2020)
Article Google Scholar
-
Huang, T., Li, S., Jia, X., Lu, H. & Liu, J. Proc. IEEE/CVF Conf. Comput. Vis. Pattern Recognition, 14781-14790 (2021).
Article PubMed Google Scholar
-
Mannam, V. et al. Optica 9, 335-345 (2022).
Article Google Scholar
-
Lequyer, J., Philip, R., Sharma, A., Hsu, W.H. & Pelletier, L. Nat. Mach. Intell. 4, 953-963 (2022)
PubMed Google Scholar
-
Rehman, A. et al. Sci. Rep. 14, 18184 -17 (2024)
Article PubMed Google Scholar
-
Wang, Y. et al. Nat. Commun. 16, 9396 (2025)
Article PubMed Google Scholar
Download references

Related Posts