Tyson Foodservice operates as a critical division within Tyson Foods Inc., using its extensive protein production capabilities to supply a diverse array of foodservice clients across multiple sectors. As one of the largest protein providers in the US, Tyson Foods produces approximately 20% of the nation’s beef, pork, and chicken, which forms the foundation of

Prediction of influenza-like illness incidence using meteorological factors in Kunming
Abstract
Background
The global incidence of Influenza-Like Illnesses (ILI) has demonstrated an overall increasing trend. In the context of climate change, it is imperative to conduct research on the impact of meteorological factors on epidemic prediction.
Objectives
To assess the potential of meteorological factors with Long Short-Term Memory (LSTM) models for improving ILI incidence prediction accuracy, providing a reference for the future development of related public health applicability.
Methods
Data on ILI incidence from November 2017 to January 2022, along with corresponding meteorological data over the same period. Pearson correlation analysis was employed to validate the relationship between the meteorological data and ILI incidence. Various LSTM architectures to forecast ILI incidence. These models were tested both with and without incorporating the the meteorological data as an additional feature. Additionally, Kernel Attention Network (KAN) was introduced into the LSTM models to enhance their nonlinear learning capability.
Results
The description of ILI incidence and meteorological show that all the related variables are characterized by certain periodic changes. After incorporating the meteorological data into the analysis, the Mean Absolute Percentage Error (MAPE) for predicting ILI incidence using LSTM and attention-based stacked LSTM was 46.31% and 30.74%. Additionally, the application of KAN to these models further enhanced their performance.
Conclusions
The study demonstrates that stacking layers within LSTM models and incorporating KAN can further enhance the representational capabilities of these models. These improvements suggest that by leveraging meteorological data and utilizing advanced LSTM architectures, those can achieve more accurate and reliable predictions of ILI incidence.
Supplementary Information
The online version contains supplementary material available at 10.1186/s12889-025-23710-3.
Keywords: Influenza-like illness, LSTM, KAN, Prediction, Meteorology
Introduction
Influenza is a significant global health concern that continues to inflict significant morbidity on children [1, 2]. Influenza-like illness (ILI) is a frequent and nonspecific indicator of influenza that is predominantly employed for symptom monitoring. It is a term that refers to various respiratory illnesses that exhibit symptoms similar to those of influenza. It is defined as outpatients with an acute respiratory infection, a body temperature exceeding 38 °C, and a cough or sore throat without needing laboratory confirmation of the influenza virus [3]. By monitoring ILI cases, health officials and researchers can gain insight into the spread of influenza and implement the necessary measures to mitigate its impact [4]. The Chinese Center For Disease Control And Prevention (China CDC) data analysis indicates a consistent upward trend in influenza outbreaks during December of each year, which is accompanied by a sustained increase in epidemic occurrences [5]. The epidemic trend of ILI initially decreased rapidly during the post-pandemic period of COVID-19. Nevertheless, the severity of ILI outbreaks has progressively increased in recent years, even on a global scale [6].
The emergence of a complex public health concern is indicated by the growing consensus that traditional surveillance systems and early warning data are insufficient for addressing current pandemics due to the large population and high number of seasonal influenza infections in China [7]. The growing consensus is that traditional surveillance systems and early warning data are inadequate for tackling current pandemics, indicating the emergence of a complex public health concern [8]. Conventional syndromic surveillance, which relies on case reporting, suffers from delays due to factors such as tendencies to seek medical attention, laboratory confirmation, and reporting procedures, thereby hindering the timely detection of influenza outbreaks [9]. These delays can lead to significant consequences, including the spread of the virus to more people and increased pressure on healthcare systems. Therefore, there is a need for more advanced and real-time surveillance systems that can detect outbreaks earlier and provide more accurate information to public health officials and decision-makers. Recently, due to the powerful feature learning ability, deep learning has emerged as a dominant force across various domains. Long Short-Term Memory (LSTM) has garnered extensive attention in disease prediction [10]. Wei et al. [11] demonstrates that the performance of influenza-like illness incidence prediction can be improved using Baidu Index based on LSTM. Yang et al. [12] employed an ensemble deep learning model study for influenza epidemic trend surveillance and prediction. However, these studies did not consider meteorological factors such as temperature, humidity, and wind speed, those may play crucial roles in the transmission of influenza. Changes in meteorological conditions may affect the survival and transmission capacity of influenza viruses, thereby influencing the outbreak and spread of ILI epidemics.
Seasonal trends in ILI epidemics further underscore the influence of meteorological factors [13]. Both lower temperatures and lower humidity were associated with increasing frequencies of influenza viruses of children [14]. There is a study found that influenza viruses coat themselves in fatty material that hardens and protects the organism in colder temperatures [15]. This adaptation allows the virus to remain viable and infectious for longer periods in cooler environments, potentially contributing to the increased transmission observed during colder months. These findings suggest that meteorological conditions may play a significant role in the transmission dynamics of influenza. Kunming, located in the southwest of China, is known for its mild climate, characterized by the large diurnal temperature and low humidity. Moreover, the ideal meteorological conditions for the transmission of influenza viruses typically include cooler temperatures and lower humidity, which can enhance viral stability and facilitate transmission [16]. Such findings underscore the importance of considering meteorological factors in understanding and predicting influenza dynamics.
Therefore, this study aimed to develop a practical framework using meteorological data with deep learning models to combine the advantages of different forecasting models for prediction of ILI incidence and facilitate influenza preparedness in the future.
Methods
Study subjects
Between November 2017 and January 2022, the data of ILI incidence from the Kunming Children’s Hospital, a premier public pediatric hospital in the southwest of China, renowned for its comprehensive testing and treatment services for respiratory diseases in children. ILI incidence were defined based on hospital reported ILI case counts. The meteorological data was obtained from the province-wide average temperature, average barometric pressure, and average wind speed from November 2017 to January 2022 from the Yunnan Provincial Meteorological Bureau. Ethical approval has been reviewed by Ethics Committee of local Hospital. The research adhered to the principles outlined in the Declaration of Helsinki.
LSTM model
In this research, the incidence of four months was taken as a circle to input and use the LSTM structure to output the incidence rate or number of incidence in the next month. The hyper-parameters of LSTM such as the number of hidden layer nodes, learning rate, training batches, etc. were adjust. Moreover, this study conducted several rounds of experiments for different learning rates and dropout ratios, and finally selected a relatively optimal combination of parameters.
Stacked LSTM (ST-LSTM)
This study extend the number of layers of the LSTM from 1 to 2 (or more) to test the effect of deep structure on the model performance to improve the prediction accuracy to some extent, but it also increases the complexity and training time of the network. Moreover, to ensure the fairness of the experiment, this study increase the depth of the network while keeping other parameters of the single-layer LSTM unchanged to compare the prediction effect of the single-layer vs. multi-layer LSTMs.
Attention-based LSTM (A-LSTM)
For time series data, attention mechanisms typically assign learnable weights to different time steps, which are then weighted and summed with the raw output to obtain more context-specific information. The hidden states of each time step are first mapped to obtain a representation that can be used for scoring. Softmax operations are performed on the scores of all time steps to obtain a distribution of attention weights. Weight the outputs of all time steps with these weights to obtain a final context vector and use this context vector for subsequent prediction or classification. This research incorporated Temporal Attention into the LSTM network, so that the model can focus more on neighboring months or more influential historical information when predicting the incidence rate of a certain month, thus further improving the prediction accuracy.
Combination of LSTM and Kolmogorov-Arnold Network (KAN)
KAN is a novel neural network architecture that aims to replace the linear weights in traditional networks with learnable unitary functions, thereby improving the expressive power of the model and reducing the number of parameters [17]. In traditional LSTM networks, the last layer is often a Fully Connected Layer that maps the hidden states to the predicted values [18]. In this study, we try to replace this linear layer with the KAN layer in order to obtain better fitting ability and generalization performance under the condition of similar model size.
Parameter settings for the model
To alleviate the overfitting problem on small datasets, dropout and regularization strategies were used in this study. After several experiments, this study finalized the following model parameter settings: input size (input_size_inc_only) as a single feature containing only the number of onset, or 4 features containing the number of onset and 3 meteorological factors (barometric pressure, temperature, wind speed) (input_ size_with_meteor). The hidden layer size of the LSTM network was set to 16, the number of standard LSTM layers was 1 layer, and the number of ST-LSTM layers was 2 layers. The learning rate is set to 0.01 using the Adam optimizer, the training period is 200 rounds, the time window size is 3 months, and the batch size is “Full Batch”, i.e., all the data is used for each training. This study also improve the training efficiency of the model by using the Adam optimizer, which is able to converge faster and deal with the gradient vanishing and gradient explosion problems than the traditional method. In addition, the model is optimized over 200 training cycles and cross-validated against different hyperparameters.
Indicators for model evaluation
To compare the strengths and weaknesses of various models on the morbidity prediction task, this paper employs three standard evaluation metrics: Root Mean Square Error (RMSE), MAPE, and Mean Absolute Error (MAE). RMSE represents the Euclidean distance between predicted and actual values, MAPE concentrates on the average of the predicted relative errors, and MAE illustrates the overall magnitude of the absolute errors. The absolute error’s aggregate magnitude.
Statistical techniques
The relationship between each meteorological indicator and the number of influenza incidence was first verified using the Pearson correlation coefficient. In order to explore the role of meteorological variables in predicting disease cases, two sets of experiments were conducted: one without meteorological variables and the other with meteorological variables. The methods used in this study include LSTM, ST-LSTM, A-LSTM and Attention Mechanism-based Stacked LSTM (A-ST-LSTM). To enhance the nonlinear learning ability of LSTM, this study combined LSTM with KAN networks and propose four approaches: LSTM-KAN, ST-LSTM-KAN, A-LSTM-KAN, and A-ST-LSTM-KAN. In this study, all the data reading and preprocessing, visualization and analysis, and model training were done in Python environment (version 3.12.1). The deep learning part was done using PyTorch (torch and torch.nn modules) for model definition and training, and the optimizer used torch.optim. The structure of the unrolled LSTM model for predicting ILI incidence is illustrated in fig. 1, in which X=[Xt−4,Xt−3,Xt−2,Xt−1] represents the input data, which consists of the incidence data from the previous four months. The output is the predicted incidence data for month t. The implementation principle of ST-LSTM is shown in fig. 2. The workfow of attention-based LSTM is illustrated in fig. 3. Moreover, for quantitative variables such as meteorological data(pressure, temperature, wind speed) and ILI incidence, the mean (M) and standard deviation (SD) were calculated to assess central tendency and dispersion.
Fig. 1.
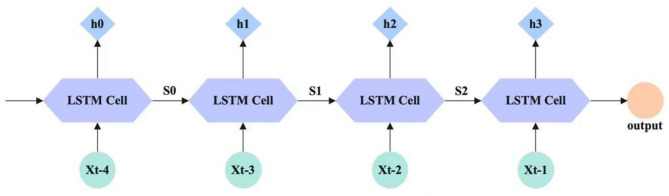
Unrolled LSTM structure by time steps
Fig. 2.
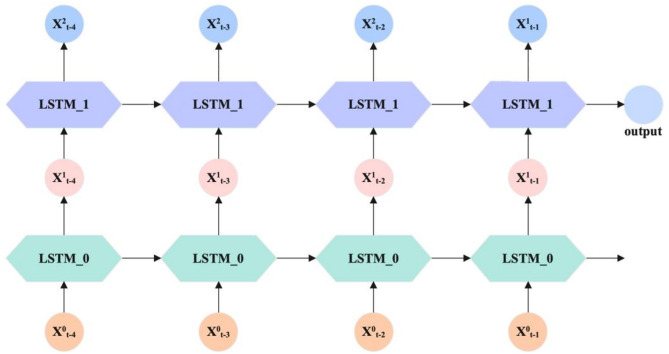
The flowchart of stacked LSTM
Fig. 3.
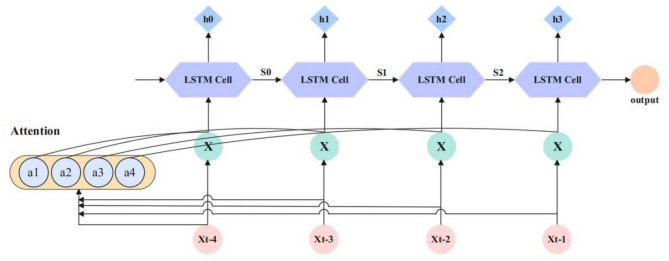
The flowchart of attention-based LSTM
Quality control
The data of ILI reported in this study were sourced from large, representative, and comprehensive hospitals within the region that possess the capability to diagnose and treat respiratory diseases. The reported information was subjected to additional verification by personnel specifically trained to guarantee the integrity of the data before it was published. Furthermore, the dataset’s robustness is further bolstered by the substantial sample size of cases between 2017 and 2022. In the interim, the National Environmental Monitoring Center reviewed and disseminated meteorological data, ensuring its reliability and accuracy [19].
Results
Description of ILI incidence and meteorological data
Figure 4 contains four sub-figures showing the trends of different variables over time. Figure 4A represents ILI incidence, which shows obvious cyclical fluctuations, with peaks concentrated in December-January each year and larger fluctuations. Figure 4B demonstrates changes in barometric pressure which shows overall cyclical fluctuations and smaller changes. Figure 4C reflects the seasonal change of temperature, with smoother and obvious cyclic fluctuations, and the temperature shows regular rise and fall within each year. Figure 4D shows the trend of wind speed which is relatively smooth but with some fluctuations. The data analyzed of summary statistics of both meteorological data and ILI incidence can be found in the Additional file 1.
Fig. 4.
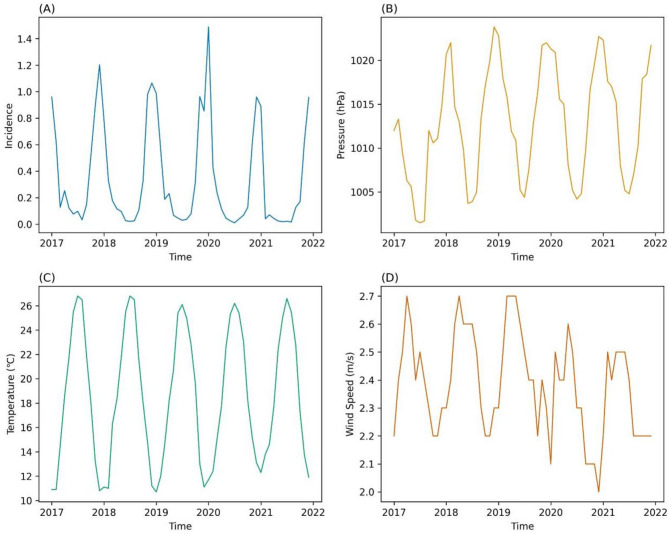
Time series chart of ILI incidence and meteorological factors *This time series chart illustrates the temporal dynamics of ILI incidence rates and key meteorological variables in Kunming over a specified period. The x-axis represents years, while the y-axis displays the quantitative variables (A: ILI incidence B: Pressure, C:Temperature, D:Wind speed)
Correlation analysis of ILI incidence and meteorological data
This study used pearson correlation analysis to explore the association between three meteorological parameters, namely temperature, barometric pressure and wind speed, and the number of influenza cases as shown in Table 1. The number of cases showed a significant positive correlation with barometric pressure (r = 0.694, p < 0.001) and a significant negative correlation with temperature (r=−0.779, p < 0.001) and wind speed (r=−0.514, p < 0.001). The same significant correlations existed among the meteorological factors (Fig. 5).
Table 1.
Pearson correlation analysis between meteorological factors and the number of ILI incidence
| Parameter 1 | Parameter 2 | r | t | P |
|---|---|---|---|---|
| incidence | Pressure (hPa) | 0.694 | 7.340 | < 0.001 |
| incidence | Temperature (℃) | −0.779 | −9.453 | < 0.001 |
| incidence | Wind Speed (m/s) | −0.514 | −4.569 | < 0.001 |
| Pressure (hPa) | Temperature (℃) | −0.876 | −13.807 | < 0.001 |
| Pressure (hPa) | Wind Speed (m/s) | −0.430 | −3.631 | < 0.001 |
| Temperature (℃) | Wind Speed (m/s) | 0.298 | 2.374 | 0.021 |
Fig. 5.
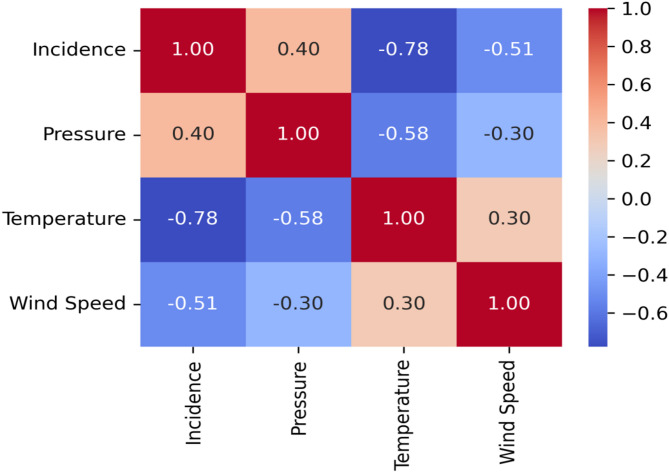
Pearson correlation heat map of ILI incidence rate and main meteorological factors *The color gradient represents the magnitude and direction of the correlation coefficient r: red represents positive correlation, blue represents negative correlation, and the depth of the color scale corresponds to the strength of the correlation (color bar on the right). The diagonal element is fixed at 1.00; The remaining numbers are the calculated values of r (rounded to two decimal places). The significance levels were all p < 0.001
Results of prediction for ILI incidence
From the results of the experiments without meteorological variables, A-ST-LSTM performs the best in the MAPE metrics with 77.76%, which is better than other models such as LSTM(138.81%), LSTM-KAN (78.86%), ST-LSTM (63.88%), ST-LSTM-KAN(64.91%), A-LSTM (99.70%), A-LSTM-KAN (65.71%) and A-ST-LSTM-KAN (93.21%). In the experiments containing meteorological variables, LSTM performed better in terms of MAPE (46.31%) compared to 31.16% for ST-LSTM, and further introduction of KAN resulted in a MAPE of 40.77% for ST-LSTM-KAN. The MAPE of the attentional mechanism combined with A-ST-LSTM was 30.74%, and after A-ST-LSTM-KAN was 30.50% (Table 2)
Table 2.
Prediction results of ILI incidence by all the models
| Type | Models | RMSE | MAE | MAPE (%) |
|---|---|---|---|---|
| Without meteor | LSTM | 206.76 | 131.68 | 138.81 |
| LSTM-KAN | 132.15 | 90.27 | 78.86 | |
| ST-LSTM | 151.51 | 91.84 | 63.88 | |
| ST-LSTM-KAN | 154.16 | 92.15 | 64.91 | |
| A-LSTM | 166.73 | 111.42 | 99.70 | |
| A-LSTM-KAN | 161.95 | 103.5 | 65.71 | |
| A-ST-LSTM | 128.19 | 87.71 | 77.76 | |
| A-ST-LSTM-KAN | 150.59 | 102.57 | 93.21 | |
| With meteor | LSTM | 89.44 | 54.05 | 46.31 |
| LSTM-KAN | 127.11 | 70.35 | 35.26 | |
| ST-LSTM | 101.37 | 54.77 | 31.16 | |
| ST-LSTM-KAN | 69.31 | 43.89 | 40.77 | |
| A-LSTM | 214.14 | 97.44 | 56.19 | |
| A-LSTM-KAN | 136.65 | 78.88 | 48.06 | |
| A-ST-LSTM | 86.82 | 50.39 | 30.74 | |
| A-ST-LSTM-KAN | 109.33 | 47.28 | 30.50 |
In this study, to demonstrates the prediction effect of all methods without including meteorological variables. it can be seen that the A-ST-LSTM method performs better in tracking the trend of the true cases rate (Fig. 6)
Fig. 6.
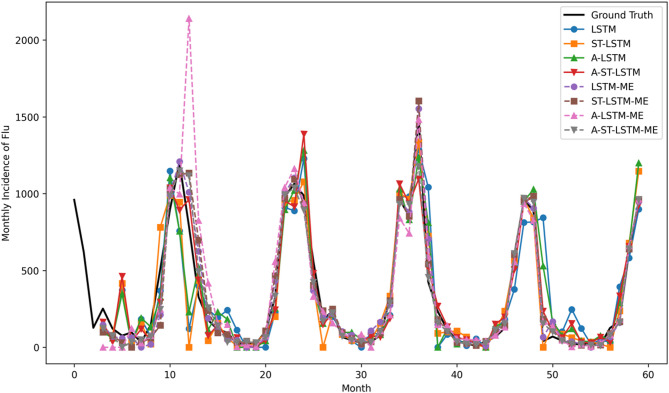
Comparison between the predicted results of the monthly incidence rate of ILI based on eight models without KAN (60 months in the validation set) and the true value *The black solid line is the observed value; The solid lines in blue, orange, green, and red represent LSTM, ST-LSTM, A-LSTM, and A-ST-LSTM without meteorological variables, respectively; The purple, brown, pink, and gray dashed lines represent LSTM-ME, ST-LSTM-ME, A-LSTM-ME, and A-ST-LSTM-ME, respectively, with the addition of meteorological variables. The horizontal axis represents the month number, and the vertical axis represents the number of ILI cases in the current month)
Compared with single-layer LSTM, multi-layer stacked LSTM can better learn the complex features in the time series, and the attention mechanism further improves the model’s ability to capture key features. The A-ST-LSTM-KAN method has a better performance in trend fitting (Fig. 7)
Fig. 7.
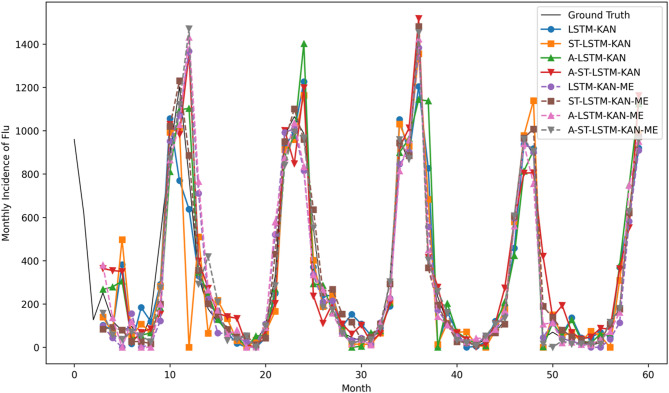
Comparison between the predicted results (60 months in the validation set) of the monthly incidence rate of ILI based on eight models with KAN and the true value *The black solid line is the observed value; The solid lines in blue, orange, green, and red represent LSTM-KAN, ST-LSTM-KAN, A-LSTM-KAN, and A-ST-LSTM-KAN, respectively; The purple, brown, pink, and gray dashed lines represent LSTM-KAN-ME, ST-LSTM-KAN-ME, A-LSTM-KAN-ME, and A-ST-LSTM-KAN-ME, respectively. The horizontal axis represents the month number, and the vertical axis represents the number of ILI cases in the current month
Discussion
The strategy for preventing and controlling infectious diseases fundamentally relies on forecasting epidemic trends. Utilizing a variety of data sources, such as integrating climate variables with analytical techniques, this foresight enables the implementation of proactive measures, which substantially mitigate the societal and health consequences of infectious diseases.
At present, climate change has heightened awareness of the direct and indirect effects of the environment on human health. Investigating the effects of climate change on population health has consistently been a focal point of research. Research has demonstrated that influenza outbreaks are associated with numerous factors, particularly climate related [20]. Existing studies also have shown that the contribution of the climate to construct a prediction model of influenza [21–23]. Kunming’s plateau location at approximately 1900 m, a relatively low barometric pressure, and an optimal temperature range facilitate the survival and transmission of influenza viruses. Even though Kunming experiences relatively higher temperatures during the winter, the significant diurnal temperature variation may reduce human immunity during abrupt temperature changes, thereby increasing the risk of influenza virus infection. Furthermore, the dissemination of influenza viruses may be facilitated by the acceleration of airflow, which can be facilitated by the fluctuation of wind speed due to topographical and seasonal factors. This study first take three crucial meteorological components (barometric pressure, temperature, and wind speed) into the research on predicting ILI incidence.
Mathematical models are essential for predicting disease transmission dynamics and potential cases as Artificial Intelligence (AI) advances [24]. Machine learning algorithms have demonstrated notable advantages in the realms of prediction and recognition. Among these, LSTM is proposed to solve the problem of gradient disappearance or gradient explosion that may occur in traditional RNNs when dealing with long sequences [25]. Studies have confirmed that LSTM outperforms certain statistical-based algorithms, highlighting its efficacy and potential in addressing complex time series forecasting challenges [26]. Numerous research have extensively explored influenza forecasting over extended periods such as the Auto-Regressive Integrated Moving Average (ARIMA) model has been pivotal in seasonal influenza forecasting due to its robust handling of temporal dependencies and cyclical patterns inherent in epidemiological time-series data [27]. The integration of social media data, including Google, Twitter and Baidu index into disease surveillance represents a paradigm shift in epidemiological forecasting, capitalizing on real-time digital biomarkers to augment traditional surveillance, but the disparities in internet access and misinformation campaigns introduce variability [28]. These studies did not account for the effects of meteorological factors. Therefore, conclusions drawn from these studies remain contentious. At present, there are few reports on the prediction of influenza infection with an RNN combined with meteorological data. This study reviewed the corresponding meteorological data and proposed an LSTM model to predict the occurrence of influenza in Kunming, China. The results in this study show that combining the meteorological data performed significantly well.
The predictive performance of specific models is enhanced by the incorporation of KAN, even though A-ST-LSTM performs well in terms of MAPE, according to the findings of this study. Moreover, the introduction of meteorological variables significantly reduced the MAPE value, indicating that meteorological factors play an important role in disease prediction. Meanwhile, the introduction of KAN can improve the performance in some models, but its effect varies depending on the model structure in the study. Compared with single-layer LSTM, multi-layer stacked LSTM has certain advantages in performance, especially the effect is more obvious in the prediction containing meteorological variables [29–31]. The introduction of the attention mechanism also has a positive effect on improving the model performance, but its effect depends on the specific model and data characteristics. Comprehensive comparison shows that the ST-LSTM and A-ST-LSTM models perform better after the introduction of meteorological variables, especially the A-ST-LSTM shows a greater advantage in the MAPE index. There are three main reasons why KAN only plays a positive role in some cases: (1) Matching model capacity with data size: KAN significantly increases the number of parameters. When the base model capacity is insufficient and the sample size is sufficient (such as single-layer LSTM), it can significantly improve the nonlinear expression ability. However, for A-ST-LSTM that has already been overlaid with spatiotemporal gating and attention, it may lead to overfitting and limited returns; (2) Differences in feature coupling methods: KAN excels at capturing complex nonlinear relationships between multi-source features, so its improvement on LSTM-KAN is particularly significant in “meteorological” scenarios, while its advantage is not prominent in “no meteorological” scenarios with only a single disease sequence; (3) Overlapping network component functions: ST-LSTM has explicitly modeled spatiotemporal interactions, and overlaying KAN can easily lead to functional redundancy.
The strength of this research is the application of interdisciplinary methods to examine the influence of multifarious meteorological variables on ILI incidence. Extraordinary, this study prioritizes the evaluation of absolute prediction error magnitudes and their public health applicability over traditional significance testing of aggregated metrics. The study opts to report model performance using intuitive error metrics: RMSE, MAE and MAPE, those directly quantify the discrepancy between predicted and observed incidence rates to directly reflect the ability to minimize deviations across the entire prediction horizon. By incorporating advanced deep learning techniques, this research has provided deeper insights into the importance of these factors in predicting ILI incidence. This study advances the understanding of the complex relationships between meteorological conditions and ILI incidence, whcih offers valuable evidence for the development of targeted public health policies and intervention strategies. Moveover, the findings contribute the potential of deep learning in enhancing infectious disease prediction and management.
It is prudent to acknowledge the limitations of this study. First, the absence of a unified standard for selecting model parameters and nodes introduces variability in model performance, as different configurations may yield inconsistent results across datasets or contexts. This lack of standardization limits the generalizability of the study and may hinder the model’s adaptability to diverse epidemiological scenarios. Futhermore, the exploration of the effects of environmental and meteorological factors on the prediction ILI incidence has primarily been conducted based on data from a single region. This geographical limitation introduces data bias, as meteorological patterns, population demographics, and healthcare infrastructure vary substantially across regions. Models trained on such localized data may fail to capture regional heterogeneities, leading to poor transferability. Consequently, future research should aim to broaden the scope of the analysis to encompass a greater number of regions, thereby facilitating a more thorough comprehension of the meteorological factors that influence the prediction of ILI. Ultimately, this will enhance the efficacy of public health interventions and disease management strategies by facilitating the development of more generalized and transferable models that can be applied to diverse contexts.
Conclusions
This study evaluated the effectiveness of combining KAN with four distinct methods for predicting the incidence of ILI incidence. The results demonstrated that the integration of the meteorological factors positively influenced the predictive accuracy of the model. In addition, the prediction performance was further improved by implementing a multi-layer mechanism, which contributed to the development of predictive modeling in infectious disease epidemiology.
Supplementary Information
Acknowledgements
Not applicable.
Abbreviations
- ILI
-
Influenza-like illnesses
- LSTM
-
Long Short-Term Memory
- KAN
-
Kernel Attention Network
- MAPE
-
Mean Absolute Percentage Error
- RMSE
-
Root Mean Square Error
- MAE
-
Mean Absolute Error
- AI
-
Artificial Intelligence
- ARIMA
-
Auto-Regressive Integrated Moving Average
Authors’ contributions
Conceived and designed the research: Kai Liu Analyzed the data: Juan Xie, Rong-man XieWriting-original draft preparation: Pei-long LiWriting-review and editing: Rong-wei HuangFinal approval of the version to be published: Kai Liu.
Funding
1. The 14th Five-Year Plan Yunnan Province Clinical Key Specialties Construction Project – Pediatrics.
2. Kunming Health Science and Technology Talent Cultivation Program.
Grant No.2024-SW(Backup)-52.
Data availability
Data is provided within the manuscript or supplementary information files. In addition,the other data that support the findings of this study are available from the corresponding author upon reasonable request.
Declarations
Ethics approval and consent to participate
The study was approved by the Ethics Committee of Kunming Children’s Hospital & Children’s Hospital Affiliated to Kunming Medical University (approval No. 2025-05-050-K01).As this research merely employs pre-existing medical records and data, without infringing upon the identities or privacy of the participants and without imparting any risks or harm to participants, the consent for participate waived by the Ethics Committee of Kunming Children’s Hospital & Children’s Hospital Affiliated to Kunming Medical University in view of the retrospective nature of the study and all methods were performed in accordance with relevant guidelines and regulations.
Consent for publication
Not applicable.
Competing interests
The authors declare no competing interests.
Footnotes
Publisher’s Note
Springer Nature remains neutral with regard to jurisdictional claims in published maps and institutional affiliations.
Pei-long Li and Rong-wei Huang contributed equally to this work.
Contributor Information
Juan Xie, Email: .
Kai Liu, Email: .
References
- 1.Olsen 1TJI, Reed SJ. Seasonal incidence of symptomatic influenza in the united States. Clin Infect Dis. 2018;66(10):1511–18. [DOI] [PMC free article] [PubMed] [Google Scholar]
- 2.Blanton 2GLA, Ferdinands LH. Prevention and control of seasonal influenza with vaccines: recommendations of the advisory committee on immunization Practices – United states, 2022-23 influenza season. MMWR Recomm Rep. 2022;71(1):1–28. [DOI] [PMC free article] [PubMed] [Google Scholar]
- 3.Thwaites 3DJ, Openshaw RS. Seasonal and pandemic influenza: 100 years of progress, still much to learn. Mucosal Immunol. 2020;13(4):566–73. [DOI] [PMC free article] [PubMed] [Google Scholar]
- 4.Yang 4HYY, Zeng J. Spatial and Temporal distribution characteristics of seasonal A(H3N2) influenza in china, 2014–2019. Zhonghua Liu Xing Bing Xue Za Zhi. 2023;44(6):937–41. Chinese. [DOI] [PubMed] [Google Scholar]
- 5.Chinese Center For Disease Control And Prevention. https://www.chinacdc.cn/jksj/jksj04_14249/. Accessed 3 Feb 2025.
- 6.Oriol 6AJ, Vázquez I. Long COVID in ARDS survivors: insights from a Two-Year-Follow-Up study after the first wave of the pandemic. J Clin Med. 2025;14(6):1852. [DOI] [PMC free article] [PubMed] [Google Scholar]
- 7.Wang 7ZL, Xu Y. Prevalence of respiratory viruses in children with acute respiratory infections in shanghai, china, from 2013 to 2022. Influenza Other Respir Viruses. 2024;18(5):e13310. [DOI] [PMC free article] [PubMed] [Google Scholar]
- 8.Ajelli 8LQH, Aleta M. Measurability of the epidemic reproduction number in data-driven contact networks. Proc Natl Acad Sci USA. 2018;115(50):12680–5. [DOI] [PMC free article] [PubMed] [Google Scholar]
- 9.Shigematsu 9OY, Taniguchi M. Experimental surveillance using data on sales of over-the-counter medications–Japan, November 2003-April 2004. MMWR Suppl. 2005;54:47–52. [PubMed] [Google Scholar]
- 10.Stocker 10BJ. The impact of network clustering and assortativity on epidemic behaviour. Theor Popul Biol. 2010;77(1):71–5. [DOI] [PubMed] [Google Scholar]
- 11.Neal 11BF. Network epidemic models with two levels of mixing. Math Biosci. 2008;212(1):69–87. [DOI] [PubMed] [Google Scholar]
- 12.Lin 12WS, Wenjing S. The prediction of influenza-like illness using National influenza surveillance data and Baidu query data. BMC Public Health. 2024;24(1):513. [DOI] [PMC free article] [PubMed] [Google Scholar]
- 13.Prel 13du, Puppe JB, Gröndahl W. Are meteorological parameters associated with acute respiratory tract infections? Clin Infect Dis. 2009;49:861–8. [DOI] [PubMed] [Google Scholar]
- 14.Chew 14CPW, Tan FT. Seasonal variation in respiratory syncytial virus chest infection in the tropics. Pediatr Pulmonol. 2002;34:47–51. [DOI] [PubMed] [Google Scholar]
- 15.Bezrukov 15PIV, Gawrisch L. Progressive ordering with decreasing temperature of the phospholipids of influenza virus. Nat Chem Biol. 2008;4:248–55. [DOI] [PubMed] [Google Scholar]
- 16.Doraisingham 16CFT, Ling S. Seasonal trends of viral respiratory tract infections in the tropics. Epidemiol Infect. 1998;121:121–8. [DOI] [PMC free article] [PubMed] [Google Scholar]
- 17.Cui 17FY, Lv X. Deep learning models for hepatitis E incidence prediction leveraging meteorological factors. PLoS ONE. 2023;18(3):e0282928. [DOI] [PMC free article] [PubMed] [Google Scholar]
- 18.Brownstein 18NEO, Ramakrishnan JS. A systematic review of studies on forecasting the dynamics of influenza outbreaks. Influenza Other Respir Viruses. 2014;8(3):309–16. [DOI] [PMC free article] [PubMed] [Google Scholar]
- 19.Zhang 19YL, Han T. Influenza epidemic trend surveillance and prediction based on search engine data: deep learning model study. J Med Internet Res. 2023;25:e45085. [DOI] [PMC free article] [PubMed] [Google Scholar]
- 20.National Environmental Monitoring Center. https://data.cma.cn/. Accessed 2 Feb 2025.
- 21.Xu 21SK, Li L. Forecasting influenza activity using self-adaptive AI model and multi-source data in chongqing, China. EBioMedicine. 2019;47:284–92. [DOI] [PMC free article] [PubMed] [Google Scholar]
- 22.Wang 22LC, Rao X. Investigating the distribution and antibiotic resistance of bacterial pathogens in clinical specimens from a Chinese maternal and child hospital: the role of environmental factors. Infect Drug Resist. 2024;17:2261–72. [DOI] [PMC free article] [PubMed] [Google Scholar]
- 23.Chen L. Application progress of ensemble forecast technology in influenza forecast based on infectious disease model. Front Public Health. 2023;11:1335499. [DOI] [PMC free article] [PubMed] [Google Scholar]
- 24.Konty 24ODR, Paladini KJ. Reassessing Google flu trends data for detection of seasonal and pandemic influenza: a comparative epidemiological study at three geographic scales. PLoS Comput Biol. 2013;9(10):e1003256. [DOI] [PMC free article] [PubMed] [Google Scholar]
- 25.Chen 25TYT, Liu DY. The prediction of Influenza-like illness and respiratory disease using LSTM and ARIMA. Int J Environ Res Public Health. 2022;19(3):1858. [DOI] [PMC free article] [PubMed] [Google Scholar]
- 26.Biggerstaff 26BRK, Brammer M. Responding to the return of influenza in the united States by applying centers for disease control and prevention surveillance, analysis, and modeling to inform Understanding of seasonal influenza. JMIR Public Health Surveill. 2024;10:e54340. [DOI] [PMC free article] [PubMed] [Google Scholar]
- 27.Han 27DS. Influenza surveillance with Baidu index and attention-based long short-term memory model. PLoS ONE. 2023;18(1):e0280834. [DOI] [PMC free article] [PubMed] [Google Scholar]
- 28.Guo 28QH, Guo Y. Predicting influenza in China from October 1, 2023, to February 5, 2024: A transmission dynamics model based on population migration. Infect Dis Model. 2024;10(1):139–49. [DOI] [PMC free article] [PubMed] [Google Scholar]
- 29.He 29GQ, Wang Z. Monthly climate prediction using deep convolutional neural network and long short-term memory. Sci Rep. 2024;14(1):17748. [DOI] [PMC free article] [PubMed] [Google Scholar]
- 30.He 30GQ, Wang Z. Assessing the effectiveness of long short-term memory and artificial neural network in predicting daily Ozone concentrations in Liaocheng City. Sci Rep. 2025;15(1):6798. [DOI] [PMC free article] [PubMed] [Google Scholar]
- 31.Guo 31HZ, Wang Q, Li Z. A hybrid Wavelet-Based deep learning model for accurate prediction of daily surface PM2.5 concentrations in Guangzhou City. Toxics. 2025;13(4):254. [DOI] [PMC free article] [PubMed] [Google Scholar]
Associated Data
This section collects any data citations, data availability statements, or supplementary materials included in this article.
Supplementary Materials
Data Availability Statement
Data is provided within the manuscript or supplementary information files. In addition,the other data that support the findings of this study are available from the corresponding author upon reasonable request.
Related Posts