Introduction Deep learning is an advanced machine learning technique based on artificial neural networks inspired by a human brain, especially featuring the capability to automatically extract complex patterns of data by multi-layer neural networks [1,2]. The neural network consists of input, hidden, and output layers. Unlike conventional machine learning algorithms, deep learning architectures have multiple
The artificial intelligence technology for immersion experience and space design in museum …
Introduction
Research background and motivations
In recent years, the rapid advancement of information technology has enabled virtual reality (VR) to play an increasingly important role in cultural display and museum space design. VR not only reconstructs historical scenes and cultural heritage, but also offers audiences an immersive, novel visiting experience that transcends the limitations of traditional exhibitions. Through the creation of virtual environments, visitors can explore artworks and exhibits more intuitively and freely, unbounded by physical space. This enhances their curiosity and engagement. Moreover, integrating VR with advanced technologies such as artificial intelligence (AI) and computer vision (CV) enables real-time analysis and feedback based on audience behavior. This allows for dynamic adjustments to display content and interaction methods, improving exhibition effectiveness and visitor satisfaction. In this study, VR serves as a key component in optimizing museum display spaces and enhancing immersive experiences. It is seamlessly combined with other technologies to offer a more interactive and personalized approach to exhibition design. This integration not only clarifies the application context of each technology but also provides a strong theoretical foundation for the experimental framework and performance evaluation.
Museums are vital platforms for cultural communication and education, as well as spaces for preserving and showcasing human history, art, science, and other forms of knowledge1,2. As society evolves, museums have shifted from being static exhibition venues to becoming diverse, interactive hubs for cultural exchange3,4. To attract more visitors and improve their experience, increasing attention has been paid to the design of exhibition spaces. Traditional museum design often relies on manual planning and subjective judgment, lacking a scientific basis for exhibit layout and spatial organization. As a result, the audience experience can suffer from limited interaction and immersion5,6,7. Additionally, changing visitor expectations have made it difficult for conventional displays to meet demands for personalization and diversity. Issues such as inefficient space use, monotonous content, and limited interactivity frequently prevent exhibitions from reaching their full potential8.
In recent years, the rapid development of AI has led to its gradual integration into museum exhibition space design9. Leveraging tools such as data analysis, machine learning (ML), and CV, AI can accurately identify visitor behavior, analyze space utilization, and dynamically optimize both exhibition content and spatial layouts10,11. These capabilities not only improve space efficiency but also allow content to be tailored to the interests and preferences of different audience groups, thereby enhancing interactivity and personalization. Moreover, AI facilitates the integration of VR and Augmented Reality (AR) into exhibitions, offering audiences a more immersive experience. This breaks away from the traditional one-way display model and fosters greater engagement through interaction and participation12,13,14. However, despite the growing presence of AI in museum settings, effectively integrating it into spatial design—particularly in ways that optimize layout, increase interactivity, and boost immersion—remains a significant challenge that warrants further investigation15,16,17.
Existing research on museum space optimization tends to focus on static layouts, with limited exploration of dynamic balancing strategies. For instance, Thanou et al. addressed congestion by applying crowd density thresholds, yet their method did not differentiate between natural clustering around popular exhibits and inefficient crowding18. Similarly, while VR and AR technologies have been employed in virtual exhibitions, their effectiveness and limitations as alternatives to physical spaces have not been fully examined. This study addresses these gaps by introducing a dynamic density threshold mechanism and a collaborative multi-technology framework. Together, these innovations support adaptive space optimization and immersive interaction design, offering a more intelligent and responsive solution for modern museum environments.
Research objectives
The primary goal of this study is to optimize museum exhibition space design using AI to enhance visitor engagement and overall experience. The specific objectives are as follows:
First, spatial layout optimization serves as a core focus. By analyzing visitor behavior data—such as dwell time and movement paths—the study employs reinforcement learning (RL), particularly the Deep Q-Network (DQN) algorithm, to dynamically adjust the exhibition layout. The aim is to maximize space utilization, minimize waste, and ensure a logical and scientifically grounded arrangement of exhibits. By simulating various layout configurations and incorporating real-time audience feedback, the system seeks to create a smoother, more interactive spatial environment that enhances the visitor experience.
Second, enhancing the immersive experience is a key component. The study integrates AR and VR technologies with AI algorithms to increase audience immersion and participation. Based on behavioral analysis, the system dynamically adjusts interaction modes. For instance, if touchscreen interaction frequency drops, the system can automatically switch to AR or VR modes to re-engage the audience. This switching mechanism is guided by multimodal ML, ensuring optimal interaction and user experience.
Finally, the feasibility and effectiveness of the proposed optimization method are evaluated. Audience feedback is collected through online questionnaires covering aspects such as spatial layout, content personalization, and immersive experience. Using statistical and sentiment analysis, the study assesses whether the AI-driven optimization improves audience interaction, enhances space utilization, and fosters emotional engagement. This evaluation serves to verify both the practicality and impact of the proposed approach in real-world applications.
Literature review
AI-Driven Spatial optimization technology
Balancing visitor distribution is a key challenge in optimizing museum space. Traditional approaches aim to reduce congestion by evenly dispersing visitors, but this can weaken the natural clustering effect around high-interest exhibits. Recent studies have shown that dynamic threshold mechanisms can effectively differentiate between “reasonable clustering” and “inefficient congestion,” providing a theoretical foundation for the balancing strategy adopted in this study19,20. AI technologies—particularly ML and CV—enable real-time tracking and analysis of visitor behavior, offering valuable data to inform exhibition space optimization21,22,23. Ivanov24 demonstrated that AI accurately identified visitor interests, supporting the creation of more targeted and effective display layouts. Similarly, Liu et al.25 proposed that analyzing audience behavior enabled museums to dynamically adjust spatial layouts, reduce overcrowding in popular areas, and avoid underutilized zones, ultimately improving the efficiency of space usage.
Further supporting this approach, Di Maio et al.26 used convolutional neural networks (CNNs) to analyze visitor walking trajectories and optimize spatial planning based on behavioral data. Their research confirmed that AI provided more precise spatial optimization strategies, reduced space waste, and enhanced exhibit accessibility. In addition, Zhang and Gao27 introduced a recommendation system to optimize exhibit content based on visitor preferences. Meanwhile, Tabuni and Singgalen28 applied deep learning and sentiment analysis to interpret emotional responses to exhibits, thereby enhancing content personalization. Regarding immersive experiences, Pisoni et al.29 proposed an AI-driven museum design that used VR technology to provide panoramic displays and generate intelligent interactive content. Wang30 further suggested that AI-powered virtual museums automatically updated exhibits and optimized virtual navigation paths using ML, ensuring smoother and more efficient visitor experiences in digital environments.
RL has been widely recognized as an effective method for optimizing museum spatial layouts. For example, Tsiropoulou et al.31 applied the Q-learning algorithm to simulate various exhibition configurations and visitor behaviors, aimed to improve space utilization and enhance the visitor experience. The core principle of RL involves continuously adjusting strategies through interaction with the environment to maximize long-term rewards. In the context of museum spaces, this means dynamically adapting the layout based on audience behavior—such as dwell time and movement patterns—to achieve more effective spatial optimization. Similarly, Meng et al.32 employed a DQN to further refine exhibit arrangements in real time. Their model adjusted exhibit placement based on visitor interests and behavioral trends, demonstrating the potential of RL in creating responsive, visitor-centered exhibition designs. These studies provide strong support for the feasibility and relevance of applying RL in this study on museum space design.
The use of CV in museums is also steadily increasing, particularly for analyzing visitor behavior and enhancing personalized experiences. According to Kalyta et al.33CV can deliver real-time feedback through facial expression recognition and eye-tracking, enabling museums to design more engaging and interactive exhibits. By capturing visitors’ facial expressions, museums can infer emotional states—such as surprise, joy, or interest—and adjust exhibit positioning or display modes accordingly to deepen emotional engagement and encourage participation. In a similar vein, Klaib et al.34 used CV to monitor eye movements and assess the attractiveness of different exhibits. Their research provides a technical framework for integrating emotional and behavioral analysis into exhibition design. With real-time data from CV systems, museums can dynamically modify exhibit content and interaction methods based on actual audience responses, thereby improving both the appeal of the displays and the level of visitor engagement.
Emotional computing and interactive design
Emotional Computing (EC) enhances interactive museum design by enabling real-time detection and analysis of visitors’ emotional responses. By integrating emotion recognition, CV, speech analysis, and related technologies, EC can continuously monitor changes in audience emotions and adjust interaction modes accordingly. According to Kwon and Yu35museums employing EC technology were able to capture emotional reactions in real time and modify the presentation of exhibition content based on that data. For instance, when visitors appeared confused or disengaged, the system responded by showcasing more appealing content or repositioning exhibits to regain their attention. This emotional feedback mechanism played a vital role in supporting personalized display and interaction strategies. Similarly, Wen and Ma36 demonstrated that EC significantly enhanced emotional engagement, thereby improving both the educational and entertainment value of museum experiences.
The application of AI in museums has evolved from single-technology use to the integration of multimodal optimization strategies. For example, Dong et al.37 proposed a dynamic path-planning model based on deep RL, which predicted visitor trajectories in real time to optimize exhibit layout. However, the model relied on offline training data and lacked the ability to adapt dynamically in real-time scenarios. Para38 developed a personalized recommendation system using multimodal sensors such as eye tracking and voice interaction, yet his system struggled with the computational demands of real-time processing across multiple technologies. Huang et al.39 attempted to integrate EC into virtual galleries, but their method relied on fixed-weight rules, limiting its capacity for adaptive learning and real-time personalization.
Research gaps and innovations
Although existing research has made progress in individual technologies, several key limitations remain. First, there is a lack of integrated technology collaboration mechanisms. Traditional approaches—such as static layout optimization and standalone emotion recognition—fail to merge data from multiple sources (e.g., behavior, emotion, spatial factors) to support dynamic decision-making. Second, real-time responsiveness is limited. Most models rely on retrospective data analysis and cannot adapt within milliseconds to real-time conditions. Third, current solutions often lack generalizability. They are typically tailored to specific types of exhibitions and do not offer a flexible framework to address diverse exhibition scenarios. To address these challenges, this study proposes an adaptive collaborative optimization framework that integrates RL (for dynamic decision-making), CV (for real-time behavior tracking), and EC (for multimodal emotion analysis). This framework enables closed-loop feedback among multiple technologies and supports dynamic adaptation across various exhibition contexts. It represents a novel contribution by bridging key gaps in previous research.
Research methodology
Optimization model of Spatial layout driven by AI
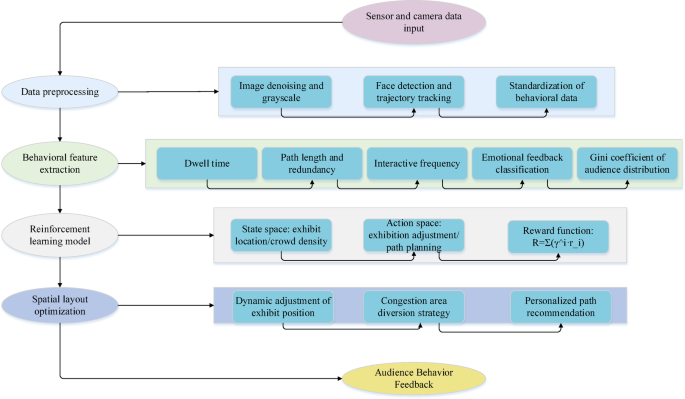
Figure 1 presents the design of the spatial optimization model, illustrating the entire process from data input to dynamic optimization. At the core of the system is the RL model, which drives layout adjustments based on real-time reward feedback. Each step is supported by segmented descriptions, preprocessing techniques, feature threshold settings, and relevant literature, highlighting the scientific rationale behind the model’s design.

Design of spatial optimization model.
Full size image
Design of Spatial optimization model
To enhance both the exhibition effect and the audience experience, this study proposes a spatial layout optimization model based on AI technology. The model integrates RL and CV to enable automated and dynamic adjustments of exhibition layouts. The optimization process begins by abstracting the exhibition space as a dynamic environment. Visitor behavior data—such as dwell time, navigation paths, and interaction frequency—are treated as inputs representing the state of the environment. The model’s actions include adjusting exhibit positions, reordering content, and redefining exhibition zones. To train the model in selecting optimal layout strategies, a reward function is constructed based on visitor behavior. Layout changes that lead to longer dwell times, more efficient navigation, or increased interaction receive higher rewards. This incentivizes the model to continuously improve the exhibition layout. The DQN algorithm is employed to implement this strategy, using a Q-value function to evaluate state-action pairs and updating its parameters through temporal difference learning. By interacting with the environment over time, the RL model refines its decision-making based on real-time feedback. This approach makes the layout more adaptive and significantly enhances visitor engagement and satisfaction. Within the RL framework, the museum environment is modeled as the agent’s environment, audience behavior as the state input, and layout adjustments as the output actions. The reward mechanism is designed to prioritize configurations that maximize audience interaction and experiential satisfaction. Therefore, this study focuses on key audience behaviors and constructs a reward function accordingly.
1) Dwell Time: Longer visitor dwell time in front of an exhibit typically indicated higher interest and engagement. Therefore, the model assigned positive rewards for increased dwell time, encouraging the system to adjust exhibit positions in a way that captured and sustained audience attention.
2) Visiting Path: A shorter or more coherent visiting path suggested that the spatial layout effectively guided the audience through the exhibition. The model rewarded rational, efficient navigation paths to reduce unnecessary detours and enhance the overall flow and user experience.
3) Interaction Frequency: The frequency of interactions—such as touchscreen use, AR/VR engagement, or physical exhibit interaction—served as a key metric of exhibit attractiveness. Higher interaction frequency received greater rewards, prompting the model to favor more interactive and engaging layout configurations.
4) Emotional Feedback: Using CV and affective computing, the system analyzed facial expressions to detect positive emotional responses such as joy and surprise. Areas that consistently elicited positive emotional reactions were given higher rewards, guiding the layout optimization toward emotionally resonant spatial arrangements.
5) Audience Distribution Balance: Uneven visitor distribution—where some areas were overcrowded while others were underutilized—was considered detrimental to visitor experience. The model rewarded more balanced audience distribution across exhibition zones to enhance space utilization and visitor comfort.
Dwell time is a key indicator of visitor interest and has been widely validated in museum behavior studies40. This study tracked the duration of time visitors spent in front of exhibits in real time. Following the threshold method proposed by Jouibari—where a stay of ≥ 3 s indicates valid interest—the attractiveness of exhibits was quantitatively assessed41. For visiting path optimization, this study referred to the path-planning framework developed by Ntakolia42which identified path coherence and redundancy as critical factors influencing the visitor experience. Interaction frequency was measured using the standards outlined in Wu’s interaction design theory43. A high interaction rate (≥ 80%) was used as a benchmark for participatory and user-friendly exhibit design. Audience emotional feedback was analyzed based on EC theory. Multimodal data—including facial expressions, voice tone, and body posture—were integrated to classify emotional states in real time44. Audience distribution balance was evaluated using the social force model, with the Gini coefficient applied to measure the evenness of crowd density across the space. This approach aimed to prevent the negative impact of local overcrowding on the overall visitor experience45. The goal was not to eliminate natural crowd clustering around popular exhibits, but rather to distinguish it from inefficient congestion using dynamic thresholds. Following Easson’s visitor interest-driven theory46a density threshold ((:{rho:}_{max}=5people/{m}^{2})) was set for exhibit areas. When local density remained at or below this threshold ((:rho:le:{rho:}_{max})), the system interpreted it as reasonable clustering and applied a base-level reward. However, if density exceeded the threshold ((:rho:>{rho:}_{max})), a congestion optimization mechanism was triggered—such as path redirection or minor exhibit repositioning—and a negative reward was assigned to the excess density ((:rho:-{rho:}_{max})). This mechanism preserved natural interest clusters (e.g., crowds around iconic pieces like the Mona Lisa) while preventing disruptive congestion. Furthermore, (:{rho:}_{max}) was adaptively adjusted based on the type of exhibit. Interactive zones (e.g., VR areas), which required more space for safe and effective engagement, were assigned a lower threshold (3 people/m²), whereas static display zones were allowed a higher limit (6 people/m²).
Realization of DQN algorithm
The DQN was employed as the primary RL algorithm47. In this framework, each spatial layout decision—such as adjusting exhibit positions or redefining exhibition zones—was treated as a distinct state. The reward signal was generated based on real-time audience behavior data, including dwell time and path selection. Through iterative training, the model progressively learned the optimal spatial layout strategy. The overall optimization objective is expressed in Eq. (1):
$$:{R}_{t}=sum:_{i=1}^{n}{text{{rm:Y}}}^{i}cdot:{r}_{i}$$
(1)
(:{R}_{t}) represents the total reward at time step t, where γ is the discount factor, (:{r}_{i}) is the immediate reward for the ith behavior, and n is the length of the behavior sequence. This equation indicates that the model’s reward depends not only on the current action but also on the expected future rewards. As a result, the model optimizes the museum’s spatial layout with a long-term perspective rather than focusing solely on immediate feedback.
To more accurately analyze visitor behavior within the exhibition space, CV technology is integrated into the system. Sensors and cameras are deployed to capture real-time behavioral data, including movement trajectories, dwell times, and gaze points. These data not only assist in evaluating the current layout’s effectiveness but also provide critical feedback for ongoing optimization. Figure 2 illustrates a sample spatial layout used in some museums.

Some examples of exhibition space layout in museums.
Full size image
In processing image data, CV technology is used to track visitor behavior through image recognition and analysis. Cameras installed throughout the exhibition space capture facial expressions, eye movements, body posture, and motion. These image inputs are processed using CNNs to extract key behavioral features.
Facial expression recognition, in particular, relies on a CNN-based deep learning model to identify and classify emotional states from captured facial images. High-resolution cameras record these facial images in real time within the museum environment. The raw data then undergoes several preprocessing steps—including image denoising, grayscale conversion, and face detection—to ensure input quality and accuracy.
The core of facial expression recognition involves feature extraction using a CNN. The convolutional layers identify critical facial features, such as the shape, position, and dynamic changes of the eyebrows, eyes, and mouth. Pooling layers reduce data dimensionality and enhance feature robustness. Finally, fully connected layers classify the extracted features into specific emotional categories such as joy, surprise, anger, sadness, and interest.
Dynamic layout optimization
To enhance the accuracy and adaptability of facial expression recognition, a pre-trained neural network model is fine-tuned using an open-access facial expression dataset. This allows the model to better accommodate the diversity and complexity of real-world facial expressions in a museum setting. Data augmentation techniques—such as rotation, translation, scaling, and image flipping—are also applied to improve the model’s robustness under varying environmental conditions.
The results of facial expression recognition are then integrated with other behavioral data. For instance, by analyzing changes in facial expressions, the system can infer visitor interest. Strong positive emotions (e.g., joy or surprise) observed while viewing an exhibit suggest high engagement, prompting the system to prioritize or enhance that exhibit’s location and interactivity. Conversely, negative emotions (e.g., boredom or confusion) may trigger adjustments to the exhibit’s content or presentation to improve visitor engagement and satisfaction.
Facial expression data can also be fused with eye-tracking and body posture information. Eye movement analysis helps identify which exhibits draw the most attention, offering valuable insights for spatial layout decisions. Meanwhile, body posture cues—such as lingering, movement, or hesitation—can reflect the visitor’s level of engagement and intent to interact. This enables the system to dynamically tailor display modes or interactive content to suit different visitor preferences.
Once processed, these image-based behavior features are quantified and fed into the RL model to guide spatial layout optimization. For example, if a visitor lingers in front of an exhibit while displaying high interest, the system may increase that exhibit’s visibility or adjust its location to maximize impact. The CV processing flow is formalized in Eq. (2):
$$:{D}_{feedback}=f({I}_{input},{W}_{model})$$
(2)
(:{D}_{feedback}) represents the audience behavior data captured from the camera. (:{I}_{input}) is the input image data. (:{W}_{model}) is the weight of the CV model. The spatial layout optimization process is dynamic, with the model continuously adjusting based on real-time interactions with the museum environment and audience feedback. For instance, if the system detects excessive crowd density in a particular exhibition area, it can proactively modify the number of exhibits or adjust the spatial arrangement to alleviate congestion. These changes aim to enhance visitor comfort and engagement. The algorithmic structure of the spatial layout optimization model is illustrated in Fig. 3:

AI-driven spatial layout optimization model structure.
Full size image
As shown in Fig. 3, the process begins with analyzing audience behavior data using CV to extract key features. These features are then fed into the RL model, which makes optimal decisions for spatial layout. The optimized layout is subsequently applied to the museum space, enabling dynamic adjustments. By combining RL and CV, the model can adapt to varying museum environments. Since exhibit locations, exhibition area mobility, and audience preferences constantly change, the model continuously learns and adjusts to enhance the visitor experience.
Exhibition Liquidity is defined as the proportion of exhibits that visitors can efficiently access within a given time. Its calculation follows Eq. (3):
$$:L=frac{{N}_{visited}}{{N}_{total}}times:left(1-frac{{T}_{av{g}_{detour}}}{{T}_{shortest}}right)times:100%$$
(3)
(:{N}_{visited}) is the number of exhibits actually visited by the audience. (:{N}_{total}) is the total number of exhibits in the exhibition hall. (:{T}_{av{g}_{detour}}) is the average time difference between the actual path of the audience and the theoretical shortest path, and (:{T}_{shortest}) is the total time of the theoretical shortest path. Equation (4) shows the calculation of Path Optimization Rate:
$$:P=left(1-frac{sum:_{i=1}^{n}left({D}_{i}-{D}_{min}right)}{sum:_{i=1}^{n}{D}_{min}}right)times:100%$$
(4)
(:{D}_{i}) is the actual path length of the (:i)-th audience. (:{D}_{min}) is the theoretical shortest path length of the corresponding exhibit sequence. The balance of crowd density distribution is measured by Gini Coefficient, as shown in Eq. (5):
$$:G=frac{sum:_{i=1}^{k}sum:_{j=1}^{k}|{x}_{i}-{x}_{j}|}{2ksum:_{i=1}^{k}{x}_{i}}$$
(5)
(:{x}_{i}) is the density of people in the (:i)-th exhibition area, and (:k) is the total number of exhibition areas. The Frequency of Congested Areas is defined as the proportion of exhibition areas where the daily pedestrian density exceeds the threshold (5 people/m2), as shown in Eq. (6):
$$:F=frac{sum:_{t=1}^{T}{C}_{t}}{Ttimes:k}times:100%$$
(6)
(:{C}_{t}) is the number of congested exhibition areas in the (:t) hour. (:T) is the total observation time (hours), and (:k) is the total number of exhibition areas.
This study referenced standard museum industry guidelines on crowd density, which recommended limiting exhibition areas to a maximum of five people per square meter to ensure visitor comfort. These guidelines were further adjusted to reflect the specific spatial layout and exhibit types of the target museum. A two-week on-site test was carried out to collect visitor flow data across different time periods. Simulations then assessed space utilization and visitor experience under varying density thresholds. The analysis showed that maintaining a density of five people per square meter effectively prevented congestion, maximized space use, and improved the overall visitor experience.
Interactive experience optimization model
Design of personalized recommendation model
To further enhance immersion in the museum space and increase audience engagement, this study also developed an AI-based interactive experience optimization model, as illustrated in Fig. 4, alongside the spatial layout optimization.

Optimization model of museum interactive experience.
Full size image
A key component of the interactive experience optimization model shown in Fig. 4 is an intelligent recommendation system driven by audience behavior data. By analyzing real-time data such as interest points, dwell time, and interaction frequency, the model infers individual preferences and automatically adjusts the displayed content to provide a personalized experience. For example, if the model detects that a visitor shows strong interest in a particular exhibit—indicated by prolonged viewing or frequent interactions—the system dynamically recommends additional information about that exhibit or other exhibits with similar themes. This recommendation process is implemented using a Collaborative Filtering approach.
Hybrid recommendation strategy and cold start processing
This study adopts an item-based collaborative filtering algorithm, a method widely used in product recommendation systems. It analyzes user behavior data—such as points of interest, dwell time, and interaction frequency—to calculate similarities between exhibits and recommend others with similar themes or styles. Unlike traditional product recommendations, museum exhibition recommendations prioritize enhancing visitor immersion and interactive participation. Building on the proven success of collaborative filtering in e-commerce, this study adapts the approach to the museum context by using visitor behavior as implicit feedback. This enables the creation of a personalized recommendation model that not only captures a visitor’s interest in specific exhibits but also uncovers potential preferences across different exhibition content by integrating various behavior data. The model adjusts display content in real time to match these inferred preferences. Moreover, the collaborative filtering algorithm operates in tandem with RL, CV, and emotion computing technologies. This integration enables dynamic optimization throughout the entire process—from data collection to exhibit recommendation and interaction mode adjustment. As a result, the algorithm retains its strength in accurately capturing user preferences while effectively meeting the museum’s higher demands for personalization, interactivity, and immersive experience. By analyzing audience behavior data, including interest points, dwell time, and interaction frequency, the system infers visitor preferences and automatically tailors display content to provide a personalized experience. The algorithm calculates exhibit similarity based on this behavior data and recommends exhibits related to those in which visitors show interest. This approach effectively delivers personalized exhibition recommendations, enhancing the overall visitor experience. To further improve recommendation accuracy and address data sparsity issues, the model incorporates implicit feedback such as browsing history and dwell time. These additional data points help capture visitor preferences more comprehensively, thereby boosting the recommendation system’s performance.
To address the cold start problem in collaborative filtering, this study implements a hybrid recommendation strategy. For newly added exhibits, the system begins by extracting content-based features such as exhibit type, historical period, material, and thematic tags. It then uses cosine similarity to compare these features with those of existing exhibits, generating an initial recommendation list. As interaction data for the new exhibit accumulates, the system gradually transitions to a collaborative filtering-based recommendation approach. For first-time visitors, the system assigns them to predefined audience groups based on demographic information, such as age and cultural background. It then recommends exhibits that have historically been favored by that group. As visitor behavior data becomes available, the model dynamically updates its parameters and shifts toward a personalized recommendation based on collaborative filtering. This hybrid approach effectively balances recommendation accuracy and data availability, ensuring reliable performance during the cold start phase for both new users and new exhibits.
Adaptive adjustment of interactive mode
In the museum’s interactive experience optimization model, adaptive adjustment of interaction modes is incorporated alongside content recommendation. Interactive experiences may include touchscreen displays, AR/VR environments, audio feedback, and other formats. By analyzing real-time audience behavior, the model can intelligently modify the interaction mode to enhance engagement and participation. For instance, if the system detects low user engagement with touchscreen displays—such as infrequent touch activity—it can automatically switch to alternative modes like VR experiences or AR visualizations to improve interactivity.
This adaptive process relies on behavioral analysis and ML algorithms. The system continuously monitors audience behavior, including dwell time, viewing frequency, and interaction rates. If the interaction frequency within a particular exhibit area drops below a threshold, the system dynamically adjusts the display format to better capture attention and increase involvement. For example, introducing AR features to provide richer, more immersive content can re-engage visitors with low initial interest. The decision to change the interaction mode is guided by real-time data analysis, ensuring that the interactive experience remains responsive and tailored to visitor behavior. This optimization process is formally represented in Eq. (7).
$$:{I}_{t}=f({B}_{t},{A}_{t})$$
(7)
(:{I}_{t}) represents the interaction mode provided by the model for the audience at time t. (:{B}_{t}) represents the behavior data of the audience at time t (such as interaction frequency, residence time, etc.). (:{A}_{t}) represents the display characteristics of the current exhibit (such as exhibit type, interaction mode, etc.). Through this equation, the model can adjust the content and mode of interaction in real time.
Audiences are grouped based on demographic attributes such as age and cultural background. Age categories may include adolescents, young and middle-aged adults, and seniors, while cultural backgrounds can be classified into local and international cultures. These groupings can be established through clustering analysis of historical museum visitor data or by referencing relevant academic research and the specific context of the museum. Before the system is officially deployed, a small group of visitors with known demographic information is invited for testing. This allows observation of whether the initial recommendations based on demographic profiles align with the actual interests of these visitors. Based on the test results, the predefined audience groupings are refined and optimized. As more data is collected, online learning algorithms are employed to continuously update and improve the recommendation model. For visitors who were initially misclassified, the system automatically adjusts future recommendations based on their behavioral data, gradually increasing recommendation accuracy. Additionally, visitors can provide direct feedback on recommendations—such as through likes or bookmarks—which is also incorporated into the system to further enhance recommendation strategies.
When switching interactive modes, the system relies on real-time data to ensure a seamless transition between touchscreen and VR/AR experiences. If the interaction frequency in touchscreen mode is low, the system automatically prompts the audience to switch to VR or AR, offering a more immersive experience. Intelligent algorithms and sensors support this transition, ensuring it occurs smoothly and without disrupting the visitor’s engagement. When a user shows limited responsiveness to touchscreen interaction, the system analyzes their behavior history and current activity to recommend alternative display modes. User identification and behavior tracking technologies are employed to preserve interaction history during mode switches, maintaining a continuous and uninterrupted experience. For instance, when transitioning from touchscreen to VR or AR, the system ensures that previously viewed content is carried over and displayed in the new mode.
This adaptive optimization enables the model to dynamically adjust interactive experiences and flexibly switch between different display modes. As a result, the system delivers a more personalized and immersive museum experience that aligns closely with visitors’ needs and preferences.
Emotional computing module
To further enhance audience immersion, the interactive experience optimization model integrates EC and situational awareness technologies to detect the audience’s emotional state in real time. Based on these emotional changes, the system dynamically adjusts both the exhibit content and the interaction mode. By analyzing physiological and behavioral cues—such as facial expressions, vocal tone, and body posture—the model can assess the visitor’s emotional response and make appropriate adjustments. For instance, if a visitor appears engaged or curious, the system may display more detailed content or introduce interactive elements. Conversely, if signs of fatigue or boredom are detected, the system may shift to more entertaining or stimulating content to sustain interest and participation.
The objective of EC is to predict and interpret the audience’s emotional states using multi-dimensional input signals. This process is modeled as a multi-input, multi-output function, formally expressed in Eq. (8):
$$:{E}_{t}=g({F}_{t},{V}_{t},{A}_{t})$$
(8)
(:{E}_{t}) represents the emotional state of the audience at time t, and it is a numerical emotional score (such as positive, negative, excited, calm, etc.). (:{F}_{t}) is the audience’s facial expression data, which is extracted by facial expression recognition algorithm, including facial features such as smile, frown and wide eyes. In this study, a CNN is employed to extract facial features and learn the mapping between these features and emotional states using a large set of labeled data. The model recognizes expressions such as smiles and frowns through a deep neural network and maps them to emotional categories (e.g., happiness, anger, sadness). These features serve as indicators of audience emotional changes. When multiple viewers are present simultaneously, the system analyzes each individual’s facial expression data independently. It identifies and classifies each viewer’s facial expressions, determining their emotional state within a specific time frame. The emotional data from all viewers are then aggregated to calculate the overall emotional distribution during that period. This approach avoids the complexity of merging raw facial data and ensures accurate emotional analysis.
(:{V}_{t}) represents the audience’s voice tone data. Voice emotion is analyzed using speech recognition technology, focusing on features such as intonation, speech rate, and pitch. These vocal cues often convey subtle emotional states like happiness, surprise, or anxiety. (:{A}_{t}) refers to body posture data, which captures audience movements and postures (e.g., standing, sitting, waving) through sensors or CV. These physical behaviors can indicate emotional and physiological responses. After collecting data from facial expressions, voice tone, and body posture, a fusion model integrates these multimodal signals to derive a comprehensive emotional assessment. The final emotional score is calculated using a weighted approach, as defined in Eq. (9):
$$:{E}_{t}={w}_{F}cdot:{F}_{t}+{w}_{V}cdot:{V}_{t}+{w}_{A}cdot:{A}_{t}$$
(9)
(:{w}_{F}), (:{w}_{V}) and (:{w}_{A}) are the weights of facial expression, voice tone and body posture, respectively, indicating the importance of different signals to EC. These weights can be optimized through the training process to learn the contribution of different types of signals to emotional judgment.
In the EC module, the weights for facial expressions, voice tone, and body posture ((:{w}_{F},{w}_{V},{w}_{A})) are learned through a supervised learning framework. A multimodal dataset comprising 1,000 samples of audience behavior—including facial expressions, audio recordings, and posture videos—is annotated by experts with emotion labels (positive, neutral, or negative). A fully connected neural network integrates these multimodal features, and the weights are optimized using gradient descent to minimize the cross-entropy loss in emotion classification.
The experiment collected emotional data from audiences with diverse cultural backgrounds, including facial expressions, voice tone, and body posture. These data were analyzed using ML algorithms. By comparing the emotion classification accuracy under different weight combinations, the current weight allocation was determined. Additionally, cross-cultural validation experiments were conducted, revealing that the weights exhibit good adaptability and stability across various cultural contexts. However, slight adjustments may be necessary for specific cultures. These findings indicate that the model possesses a certain degree of generalizability while allowing for personalized adaptation based on cultural differences. The final weights, determined through 5-fold cross-validation, are (:{w}_{F}=0.52pm:0.03), (:{w}_{V}=0.28pm:0.02) and (:{w}_{A}=0.20pm:0.02) (mean ± standard deviation). Experiments show that this weight combination achieves an emotion classification accuracy of 87.6%, significantly higher than uniform weights (76.2%) and single-modality models (facial: 79.3%, voice: 68.5%, posture: 62.1%).
A Multi-technology collaborative optimization framework
This study establishes a dynamic optimization feedback loop through a collaborative multi-technology framework, as illustrated in Fig. 5. CV continuously tracks audience behavior, including movement patterns and dwell time. EC analyzes facial expressions, voice tone, and body posture to generate emotional scores—such as interest or confusion. VR devices capture interactions in virtual environments, including hotspot clicks and navigation paths. Data from these three sources are integrated into a RL model, which dynamically adjusts exhibit layouts and interaction logic based on a multi-dimensional reward function. This function assigns weights of 0.4 to dwell time, 0.3 to path efficiency, and 0.3 to emotional feedback. For instance, if EC detects persistently low emotional engagement in a particular area, the RL model can trigger a transition to AR mode, presenting dynamic content such as 3D animations to recapture audience attention. The optimized layouts and interaction modes are implemented via VR devices and physical space sensors. Their effectiveness is evaluated through audience surveys measuring immersion and knowledge acquisition. The results are continuously fed back into the AI processing layer, enabling ongoing optimization. This integrated system is the first to achieve a multi-modal, closed-loop feedback cycle of “behavior–emotion–space,” overcoming the limitations of traditional single-technology approaches.

Multi-technology collaborative optimization framework.
Full size image
Figure 5 illustrates a three-layer multi-technology collaborative optimization framework. The data acquisition layer collects real-time information on audience behavior, emotions, and interactions using CV sensors, EC analysis devices, and VR equipment. The AI processing layer integrates these data—such as movement paths, emotional scores, and VR interactions—through a RL model. This model dynamically optimizes spatial layouts by adjusting exhibit positions and refines interaction modes, including switching between AR and VR. The feedback execution layer applies these optimized results to both physical and virtual environments in real time and assesses audience experience through surveys. Together, these layers create a closed-loop system for continuous improvement.
Experimental design and performance evaluation
Experimental materials & experimental environment
Experimental materials and display methods
To verify the effectiveness of the AI-driven optimization model for museum exhibition space design, an experiment was conducted to evaluate its performance across different scenarios. User feedback was collected via an online questionnaire, focusing on the impact of the optimized exhibition design in terms of layout optimization, interactive experience enhancement, and audience emotional response.
This study employed a mixed-methods approach combining online surveys with real-world A/B testing. The online survey showcased three types of exhibition layouts—traditional, dynamic, and immersive VR/AR—through digital images and virtual models. Following psychometric standards, the survey consisted of three sections: (1) Spatial Flow (3 questions, e.g., “Is the exhibit layout easy to move around in freely?”), (2) Interaction Experience (4 questions, e.g., “Does AR/VR interaction enhance your sense of participation?”), and (3) Emotional Feedback (3 questions, e.g., “Does the exhibition content evoke emotional resonance?”). All items used a 5-point Likert scale (1 = Strongly Disagree, 5 = Strongly Agree). The survey’s reliability and validity were confirmed by a Cronbach’s α of 0.86 and a Kaiser-Meyer-Olkin (KMO) measure of 0.81, indicating good internal consistency and structural validity. Subscale reliability and validity values were as follows: Spatial Flow (α = 0.854, KMO = 0.793), Interaction Experience (α = 0.872, KMO = 0.811), and Emotional Feedback (α = 0.854, KMO = 0.804). The sample size was determined using a 95% confidence level and a 5% margin of error, resulting in a minimum theoretical sample of 267 participants. Ultimately, 282 valid responses were collected, representing age groups 18–34 years (60.3%), 35–54 years (28.7%), and over 55 years (11.0%). Participant demographics are summarized in Table 1.
Full size table
Although the sample includes participants from diverse cultural backgrounds, the proportion of those over 55 years old is relatively low (11.0%), which may limit the generalizability of the findings across age groups. To address this, an additional control experiment was conducted with 50 elderly participants (aged 60–75) recruited at the Shangqiu Municipal Museum. This group experienced the optimized layout using a simplified VR device featuring enlarged interface fonts and voice-guided instructions. Their behavioral data were then compared with those of the main experimental group (aged 18–34). To ensure data security and privacy, this study employed encryption techniques for the storage and transmission of collected emotional data. Access to these data is restricted to authorized researchers only, with clear policies defining data retention periods. Data exceeding these periods are automatically deleted. Furthermore, visitors are fully informed about the purpose, use, and protection of their data through on-site notifications and related promotional materials, guaranteeing transparency and informed consent.
The online questionnaire targeted netizens of various ages, cultural backgrounds, and museum interests. A total of 300 questionnaires were distributed, yielding 282 valid responses—a recovery rate of 94%. This robust dataset provided strong support for subsequent analyses. The experimental environment was hosted on an online platform, where exhibition space designs were presented via digital images and virtual models. High-quality digital images, generated using 3D modeling software, realistically depicted the spatial layouts, exhibit placements, and possible visitor movement routes. Each image detailed different exhibition zones, interactive areas, and rest spaces, allowing participants to intuitively assess spatial flow and layout rationality.
VR/AR scene design
The virtual model transforms the exhibition space into a three-dimensional environment within VR or AR modes, allowing audiences to freely explore the exhibition in a virtual setting. These models use precise real-world spatial data combined with interactive design, enabling users to engage with exhibits through virtual navigation tools or gestures. This approach not only demonstrates the optimized spatial layout but also lets users directly experience the immersive qualities of VR and AR technologies.
These digital representations simulate real-world exhibition spaces to provide participants with an immersive experience. The experiment uses specially designed images and models to showcase three types of exhibition spaces: (1) Traditional Layout: Exhibits are arranged statically in a conventional linear format. This setup allows the system to evaluate basic audience behavior and participation under a standard layout. (2) Interactive Dynamic Layout: Here, AI dynamically adjusts the exhibit arrangement based on real-time audience behavior. This layout incorporates interactive elements, such as AR displays and motion tracking, to enhance visitor engagement. (3) Immersive VR/AR Layout: A fully virtual environment where participants interact with exhibits using VR headsets or AR devices, delivering a highly immersive and innovative museum experience.
The novelty and immersive nature of VR/AR technology stimulate users’ curiosity and desire to explore, leading to high interest and satisfaction during their initial experience48. Enhancing social interaction features—such as multiplayer collaboration, competitions, and sharing—encourages users to participate together in the exhibition. Designing cooperative VR/AR games or challenges allows users to gain more enjoyment and fulfillment through interaction. Based on users’ interests and preferences, personalized exhibition content and interactive experiences are offered. By analyzing user behavior data, the system recommends exhibits or interactive activities that align with their interests, thereby increasing engagement and satisfaction.
These digital models and images are made available to participants via an online platform. Participants complete questionnaires based on their interactive experiences with the various exhibition designs. The visual representation of these layouts plays a crucial role in demonstrating how AI-driven optimization can enhance spatial design and improve the audience’s experience across different museum settings.
The scene layout and equipment configuration of VR/AR exhibition hall
The experiment featured two fully immersive VR exhibition halls, each covering 50 square meters. Both halls employed a hexagonal honeycomb spatial design to minimize visual fatigue. Each hall was equipped with four HTC Vive Pro headsets (resolution 1440 × 1600 per eye), two HP Reverb G2 headsets (114° field of view), and one location-based system (LBE) with ± 1.5 mm accuracy. Visitors could freely explore virtual scenes—such as “Tang Dynasty Chang’an City” and “Bronze Workshop”—using controller interactions. These scenes were created in Maya 2023 and imported into the Unity engine, featuring textures with resolutions of 4 K or higher and dynamic baked lighting with high-level real-time ray tracing. At the center of each hall, a tactile feedback floor (Taclim VR) simulated walking sensations—like cobblestone or sandy terrain—using vibrations ranging from 0 to 200 Hz.
The AR experimental area covered 30 square meters and had a circular layout with an 8-meter diameter. Its walls housed six Microsoft HoloLens 2 devices (52° field of view) and four iPad Pros equipped with LiDAR scanners (± 2 cm accuracy). Exhibit labels were linked to spatial anchors via the Vuforia engine. When a viewer gazed at an exhibit for three seconds or longer, a corresponding 3D model appeared automatically—for example, the “Marquis Yi of Zeng’s Bells” could be disassembled into 64 parts.
The VR scenes were built from high-precision point cloud data sourced from the Palace Museum’s digital archives (with errors under 1 mm). These were reconstructed into interactive models using photogrammetry, each scene containing at least five million polygons. The AR scenes combined real-world photography—captured by an Insta360 Pro 2 camera at 8 K resolution—with 3D models whose transparency could be adjusted between 20% and 80%. Key parameters of the VR and AR exhibition halls are summarized in Table 2. The VR hall enhances realism through precise positioning (± 1.5 mm) and haptic feedback delivering up to 10 N force, supporting the “body ownership illusion” theory. The AR hall features a high density of interactive nodes (5 per square meter) and low latency (≤ 0.8 s), facilitating efficient multi-user collaboration—for instance, multiple participants can simultaneously view historical details while disassembling the bells. The circular layout conforms to spatial cognition principles by ensuring visitors can view at least two interactive nodes within a 180° field of vision, reducing disruptions caused by frequent head-turning.
Full size table
To ensure efficient performance and smooth user experience, a series of optimization techniques were applied to the 3D models and system architecture. Model compression algorithms were used to reduce polygon counts and texture resolutions while preserving visual fidelity as much as possible. Large textures were divided into smaller segments using quadtree texture segmentation, which helped minimize memory usage and reduce loading times. Key resources were preloaded either before the exhibition or in the background, and asynchronous loading techniques were implemented to dynamically load assets as needed during the experience, thereby avoiding latency or stuttering. For frequently used models and textures, instancing techniques were applied to generate multiple instances from a single resource, significantly reducing memory consumption and loading overhead.
The system also supports adaptive fidelity based on device performance. High-fidelity assets are provided for high-performance devices, while medium- and low-fidelity versions are available for lower-end hardware. The system automatically detects the device’s hardware capabilities and dynamically adjusts rendering resolution and level of detail (LOD) accordingly. On less powerful devices, resolution and model detail are appropriately reduced to ensure fast loading and smooth performance. Furthermore, hardware-specific optimization strategies were adopted. Mobile platforms and PC devices each have dedicated optimization pipelines tailored to their respective performance characteristics, ensuring the system can leverage the full capabilities of the target hardware.
The technical differences and experimental adaptability between VR and AR
VR creates a fully immersive digital environment through head-mounted displays, such as reconstructions of ancient battlefields. Its primary advantage lies in maximizing the sense of presence. In this experiment, the HTC Vive Pro headset—with a 110° field of view and 90 Hz refresh rate—was used to achieve deep immersion, making it ideal for exhibits that require strong emotional engagement, such as historical reconstructions of cultural relics. In contrast, AR overlays digital content onto the real world via mobile devices or transparent displays, allowing users to remain anchored in their physical environment and maintain social interaction. The experiment used Microsoft HoloLens 2 (with a 52° field of view and gesture tracking latency ≤ 20ms) to implement AR functions, which are particularly suited to guided tours that involve real-time interaction—such as zooming in on exhibit details or making historical comparisons. Together, the two technologies are complementary: VR offers continuous narrative depth, while AR enriches the real-world scene with interactive elements.
Although advanced AI technologies such as VR and AR can deliver immersive experiences, users’ adoption and satisfaction are also influenced by the perceived ease of use and familiarity of the interfaces49. A comparison of VR and AR technology parameters is presented in Table 3. VR’s immersive environment has been shown to match real-world spaces in terms of cognitive load and emotional engagement. For example, Wang et al. demonstrated through EEG experiments that users’ neural activation patterns while viewing artworks in VR were not significantly different from those observed in physical exhibition halls (p > 0.05). AR, on the other hand, enhances user engagement by maintaining a sense of “reality anchoring” through spatial tagging and physical interaction, making it more effective for guided tours than fully virtual environments. In this experiment, dynamic switching between VR and AR modes was implemented—VR was used for thematic storytelling, while AR facilitated real-time guidance. This hybrid approach preserves the social attributes of physical space while enriching the exhibition’s informational depth. Museum staff also played a critical role in supporting users during the experience. They assisted visitors with wearing and adjusting VR equipment, provided operational guidance, and answered questions to enhance user comfort and emotional engagement. Clear signage and instructions were displayed throughout the museum to introduce the functions and usage of AI tools. Information boards and digital displays were installed in the exhibition area to explain the content, procedures, and interaction modes of the VR/AR exhibits. These measures helped reduce resistance stemming from unfamiliarity and improved overall acceptance of the system50.
Full size table
Table 3 highlights the fundamental differences between VR and AR in terms of immersion and interaction. VR offers a fully enclosed visual experience and six degrees of freedom (6DoF), making it highly effective for emotional immersion, such as reconstructing historical scenes. However, it may induce motion sickness in some users. In contrast, AR uses transparent displays and low-latency gesture interactions (≤ 20 ms), making it better suited for tasks requiring real-world context—such as examining exhibit details. In this experiment, VR was employed to simulate the entire “bronze casting process,” allowing users to virtually participate through controller-based interaction. AR was used to demonstrate the “calligraphy and painting restoration process,” enabling users to zoom in on brushstroke layers using hand gestures. This hybrid approach combines VR’s immersive storytelling capabilities with AR’s interactive adaptability, maximizing the strengths of both technologies.
Parameters setting
The spatial layout optimization model is based on a RL algorithm and integrates CV technology to enhance the design of museum exhibition spaces. The key parameters of this model and those of the interactive experience optimization model are presented in Tables 4 and 5, respectively. An exploration rate of 0.1 was chosen to balance the model’s ability to explore new strategies with the efficient use of existing knowledge for decision-making. Given the importance of long-term user experience and satisfaction in museum environments, a high discount factor of 0.95 was selected. This ensures that the model prioritizes cumulative long-term rewards over short-term gains. After 100 iterations, the performance metrics stabilized, indicating that the model had largely converged and adapted well to the spatial optimization task. The system runs on an Intel® Xeon® Scalable processor—specifically the Intel® Xeon® Gold 6354—with 24 cores, 48 threads, a base clock speed of 2.1 GHz, and a turbo boost up to 3.7 GHz. It is equipped with 1 TB of DDR4 ECC memory at 3200 MHz, ensuring system stability and reliable data processing for large-scale model training. Storage consists of four 1.92 TB NVMe SSDs configured in a RAID 10 array for speed and redundancy. The setup also includes four NVIDIA RTX 4090 GPUs, each with 24GB of GDDR6X memory, offering powerful graphics capabilities to accelerate deep learning inference, enhance CV processing, and improve affective computing efficiency.
Full size table
Full size table
In calculating the reward function for Table 4, the system first records the number of interactions a visitor has with each exhibit, along with the total number of interactive features available per exhibit. It then computes the ratio of features actually interacted with to the total available. If this ratio is 80% or higher, the interaction is classified as high-frequency, and the visitor receives a corresponding reward. For example, if a visitor engages with 8 out of 10 exhibits, their interaction frequency is 80%, which meets the reward threshold.
The emotional state carries the highest weight in calculating user interest, as positive emotions—such as smiling or expressions of surprise—are strong indicators of engagement. Gaze direction is the second most important factor; the longer a visitor looks at an exhibit, the higher the inferred interest. Dwell time is also considered, with longer durations indicating stronger attraction. These three elements are combined through a weighted algorithm to generate an “interest score.” The “facial expression interest” metric is central to assessing a visitor’s engagement with an exhibit. It evaluates the emotional state reflected in facial expressions such as pleasure, surprise, or focused attention. The interest score is determined based on: (1) Emotional state: Positive expressions suggest high engagement; (2) Gaze direction: Duration of eye contact with the exhibit; (3) Dwell time: Total time spent in front of the exhibit. When a visitor’s interest score exceeds a predefined threshold (e.g., 70%), the system interprets this as a strong indication of interest. Analysis of large-scale audience behavior data confirmed that interaction behavior significantly increases when the score reaches or exceeds 70%, making it a reliable threshold for triggering interactive responses.
Performance evaluation
Table 6 presents the behavioral comparison between the elderly group and the main experimental group. Results show that the elderly participants had significantly fewer interactions and lower immersion scores than the younger group (p < 0.01), likely due to differences in technological adaptability and usage habits. However, the simplified interaction mode still received an average satisfaction score of 4.1 out of 5 from the elderly group. This suggests that the model has some cross-age adaptability, though further improvements—such as integrating tactile feedback and voice control—are needed to enhance accessibility and ease of use for older users.
Full size table
Interface elements such as font size and button layout may not have been sufficiently user-friendly for elderly participants, potentially leading to difficulties during use and reducing both interaction frequency and immersion levels. To address this, the optimized simplified interaction mode included adjustments tailored for older users—such as larger fonts and simplified button layouts—to enhance interface accessibility. Gesture-based controls proved more challenging for the elderly to master, while controller-based operations were generally more intuitive and manageable. Therefore, interaction design should prioritize methods better suited to older users or offer multiple interaction options to accommodate different preferences, thereby improving engagement and immersive experience. Moreover, exhibition themes related to the lived experiences and historical knowledge of older participants tend to elicit greater interest, whereas abstract topics or those distant from their daily lives may be less engaging. Thus, incorporating content that aligns with the cultural and generational interests of the elderly—and adjusting themes based on their feedback—can significantly increase their participation and emotional involvement.
To determine the optimal weights for dwell time, path selection, and interactive participation in the reward function, a parameter sensitivity experiment was conducted using a grid search approach. Ten different weight combinations were tested, as shown in Table 7. The evaluation criteria included spatial smoothness, exhibit visitation rate, and visitor satisfaction. Results indicated that the best overall performance was achieved with weights of 0.45 for dwell time, 0.25 for path selection, and 0.30 for interactive participation. Under this combination, spatial smoothness improved by 19.3% (compared to 18.1% with the original weights of 0.4/0.3/0.3), the exhibit visitation rate increased to 53.1% (from 50.0%), and visitor satisfaction rose to 89.7 points (up from 85.2). This optimized configuration effectively balanced path efficiency and interaction depth, avoiding overemphasis on any single metric.
Full size table
Table 7 indicates that increasing the weight of dwell time to 0.45 and reducing the weight of path selection to 0.25 leads to better performance in exhibit visitation rate and visitor satisfaction. This suggests that placing greater emphasis on dwell time can enhance the appeal of exhibits, while reducing the path weight allows for a more flexible and less rigid visitor experience. The strong overall performance of this weight combination supports the validity of the parameter design.
To comprehensively assess the impact of the AI-driven spatial layout optimization model on museum exhibition design, a multi-dimensional data analysis was conducted. The evaluation focused on four key areas: visit fluency, interactive participation, emotional feedback and audience satisfaction, and spatial optimization and mobility. The corresponding results are presented in Figs. 6, 7, 8 and 9.
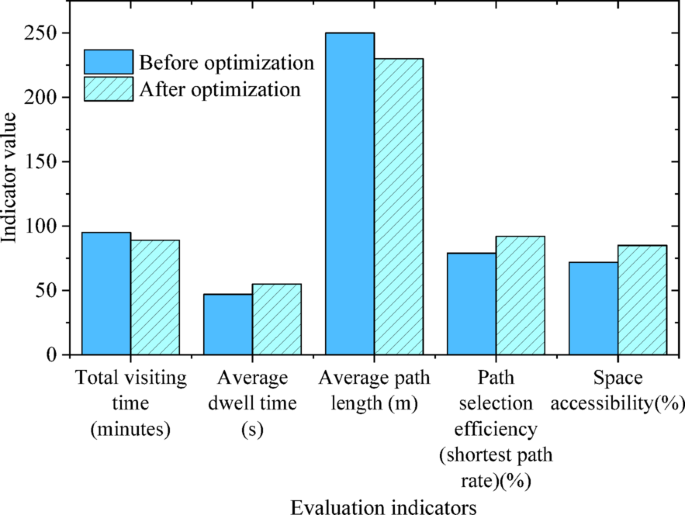
Fluency of audience experience.
Full size image
Figure 6 shows that the optimized museum layout improves the efficiency of visitors’ routes, reducing total visit time by 6.3%. This suggests a more logical overall path arrangement. Meanwhile, the average stay time increased by 17.0%, indicating greater audience interest and engagement with the optimized layout. The reduction in path length and the rise in shortest path rate demonstrate that the layout minimizes unnecessary movement and enhances visit flow. Additionally, space openness increased by 18.1%, easing crowd congestion and boosting visitor efficiency. The exhibit visit rate also rose by 50%, showing that the optimized design successfully attracts visitors to explore more exhibits and increases the appeal of the displayed content.
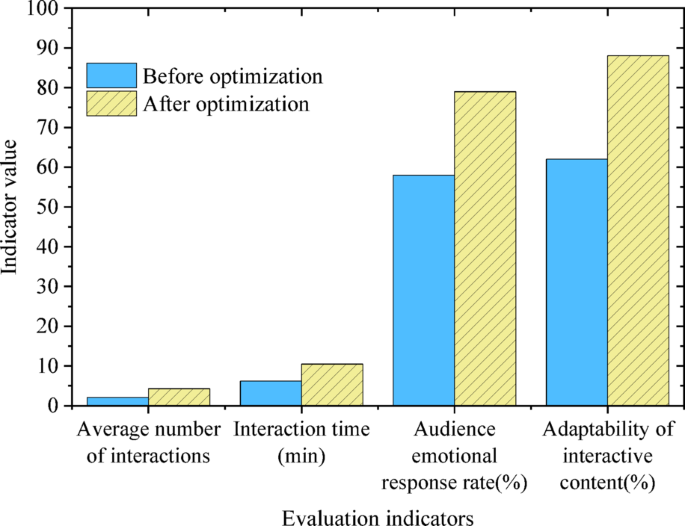
Audience interactive participation.
Full size image
Figure 7 shows that the optimized interactive design significantly enhanced audience engagement. The number of interactions increased by 104.8%, indicating that more interactive elements were activated. Interaction time rose by 69.4%, showing that visitors spent more time engaging with exhibits. The improved emotional response rate demonstrates that the AI system better detects audience emotions and adjusts the display accordingly. Additionally, adaptability of the interactive content increased by 42%, reflecting AI’s ability to dynamically tailor the display based on audience interests, thereby enhancing personalization and interaction depth.
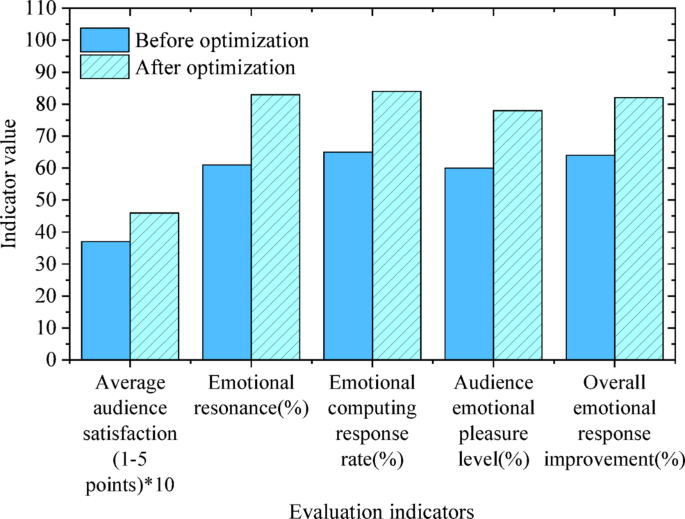
Emotional feedback and audience satisfaction.
Full size image
As shown in Fig. 8, audience satisfaction increased by 24.3% (p < 0.001, 95% confidence interval [20.5%, 28.1%]), indicating that the optimized spatial layout and interactive design significantly enhanced the overall visit experience. Improvements in emotional resonance and pleasure suggest that the optimized design not only boosts audience engagement but also fosters stronger emotional connections, increasing the enjoyment of the visit. The enhanced emotional responses demonstrate that the AI system can more accurately tailor exhibition content to meet the audience’s emotional needs, further improving satisfaction and participation. To control the Type I error rate caused by multiple comparisons, the Bonferroni correction was applied, adjusting the significance level to 0.05 divided by the number of comparisons. After correction, all reported p-values met the adjusted significance criteria, ensuring the validity of the statistical results.
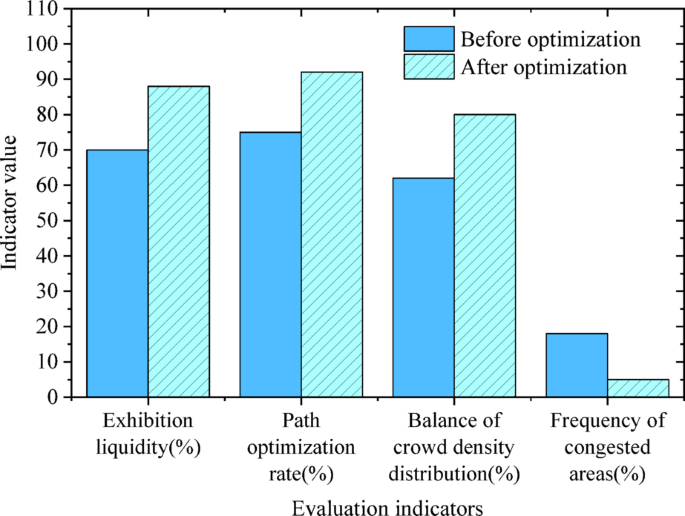
Spatial optimization and liquidity analysis.
Full size image
Figure 9 shows clear improvements in spatial mobility and exhibit accessibility. The mobility of exhibits increased from 70 to 88%, indicating enhanced connectivity and easier access between exhibits. Both the path optimization rate and the balance of visitor flow density improved, leading to more efficient use of space and better crowd management. The frequency of congested areas decreased significantly, as the optimized layout reduced audience dwell time in high-density zones, effectively preventing bottlenecks and improving overall spatial mobility and visitor experience.
To further validate the external effectiveness of the AI optimization model, a comparative experiment was conducted in the partner museum’s real exhibition halls. Two halls with similar spatial layouts, exhibit counts, and visitor traffic—Hall A and Hall B—were selected as the experimental group (AI-optimized layout with intelligent interactive system) and control group (traditional static layout with basic interactive equipment), respectively. The experiment lasted 30 days. Infrared sensors, cameras, and WiFi probes were used to collect real-time objective data, including visitor trajectories, dwell times, and interaction frequencies. Visitors from both groups also completed a standardized exit questionnaire covering spatial layout, interactive experience, and emotional feedback. A total of 412 valid responses were collected (207 from the experimental group and 205 from the control group). Results from the A/B test (Table 8) showed the experimental group achieved a 21.5% improvement in spatial smoothness, compared to 4.2% in the control group. The exhibit visitation rate rose to 58.3%, an 81.9% increase over the control’s 32.1%. Average dwell time increased by 59.5%, from 42 s to 67 s, and interaction frequency grew by 124%. Subjective feedback revealed an average satisfaction score of 88.6 for the experimental group, versus 71.3 for the control, along with a 36.8% rise in emotional resonance scores. Further path analysis indicated a 29.4% reduction in redundant movement and significantly smoother transitions between exhibit clusters in the experimental group.
Full size table
Table 8 shows that the AI optimization model significantly outperforms traditional designs in real-world settings. The notable improvement in spatial smoothness indicates that the dynamic layout effectively reduces congestion. The higher exhibit visitation rate confirms the effective synergy between the recommendation system and affective computing. Increased dwell time and interaction frequency further demonstrate that the optimized design boosts visitor engagement. The alignment between subjective satisfaction— which increased by 24.3%—and objective behavior data, such as a 124% rise in interaction frequency, supports the reliability of the results. Additionally, comparing the experimental group with virtual model data reveals that the real-world spatial smoothness improvement (21.5%) closely matches the virtual experiment’s result (19.3%), validating the external applicability of the virtual tests.
To further assess the method’s effectiveness, it was compared with spatial layout optimization approaches from similar studies51,52. The comparison results are presented in Table 9.
Full size table
Table 9 shows that the proposed method outperforms those of Min et al.51 and Kim et al.52 in spatial layout optimization, exhibit attraction, interactive experience, and technology integration. The incorporation of affective computing allows the model to better address individual visitor needs, significantly enhancing the overall visit experience. Moreover, this method is applicable not only to physical museums but can also be extended to virtual environments, broadening its potential applications. Unlike Min et al. and Kim et al., the model supports dynamic behavior analysis and real-time feedback adjustment. It captures visitor behaviors and emotional changes in real time through CV and affective computing, enabling dynamic updates to exhibition content and spatial layout. This real-time adaptability is a key technical advantage of the proposed model. In summary, the AI optimization model offers significant improvements for museum exhibition space design. It provides innovative technological solutions and demonstrates strong effectiveness and adaptability in practical applications. This approach opens new directions for the intelligent design and research of smart museums in the future.
The case experiment and analysis
Case 1
VR Reconstruction of Tang Dynasty Chang’an City.
Using archaeological data from the Shaanxi Provincial Institute of Archaeology, a full-scale (1:1) virtual model of Chang’an City covering 5.6 km² was created. This was achieved through drone photogrammetry (accuracy ± 2 cm) and Blender modeling. The experiment involved 120 participants randomly split into two groups: a VR group (60 people) and a traditional display board group (60 people). The VR group explored the city’s layout, markets, and palaces freely using HTC Vive Pro headsets. In contrast, the traditional group studied the same content via picture-and-text display boards and videos. As shown in Table 10, the VR group spent significantly more time per exhibit (98 s vs. 42 s) and achieved a 37.6% higher accuracy in knowledge tests (82.4% vs. 44.8%). Participant feedback highlighted that the sense of time-space travel (rated 8.9/10) and freedom of interaction (9.1/10) were key factors boosting their learning interest.
Case 2
AR Restoration Tour of Dunhuang Murals.
An AR system using Microsoft HoloLens 2 was deployed in Cave 257 of the Mogao Grottoes in Dunhuang. Visitors could use gestures to peel apart mural layers—background, outline, and coloring—and simulate restoration tasks like filling in peeling areas. Behavior data from 80 visitors compared AR-guided tours with traditional guided tours by human guides. Table 10 shows the AR group had a much higher interaction frequency (7.3 times per person), 3.48 times that of the traditional group (2.1 times). The AR group also completed restoration tasks 41.2% faster (4.8 min vs. 8.2 min). Emotional analysis revealed significantly higher scores in “sense of achievement” (7.8/10) and “historical immersion” (8.5/10) compared to the traditional group’s scores of 4.2 and 5.1, respectively.
Full size table
Table 10 highlights the significant advantages of VR/AR technologies in enhancing exhibition experiences across multiple dimensions. In the Tang Dynasty Chang’an City case, the VR group’s longer dwell time and higher knowledge retention demonstrate the immersive environment’s effectiveness in fostering deep learning. In the Dunhuang murals case, the AR group’s 41.2% reduction in task completion time underscores the value of experiential, hands-on learning. Additionally, the notable difference in emotional resonance scores (8.9 for the VR group vs. 5.2 for the traditional group) suggests that technology-driven storytelling can powerfully evoke cultural empathy and emotional engagement.
Discussion
This study integrates RL, CV, and EC to optimize the spatial layout and interactive experience of museum exhibitions. Evaluation results show that the optimized layout significantly enhances both spatial fluency and interactive participation. Specifically, spatial optimization reduces redundant visitor paths and improves the overall flow of movement. These findings align with those of Centorrino et al.53who also demonstrated that intelligent layout optimization could alleviate congestion and increase spatial efficiency. Furthermore, the observed improvements in exhibit visitation and audience engagement are consistent with the work of Wang et al.54which highlighted how AI-driven optimization could stimulate visitor interest and involvement. The application of EC also yielded promising results, particularly in dynamically adapting content and interaction modes. By analyzing facial expressions, vocal tone, and body posture, the system effectively identifies emotional states in real time and adjusts accordingly—thereby enhancing both personalization and interaction quality. This supports the findings of Bin et al.55who emphasized the role of EC in deepening emotional resonance and audience engagement within museum environments. The observed 18.1% improvement in spatial fluency strongly corresponds with the principles of space syntax theory, which posits that reducing topological complexity enhances spatial legibility and navigability. In this study, the RL model effectively improved spatial connectivity and accessibility by optimizing the layout, thus validating the practical relevance of space syntax in exhibition design. The EC module’s performance also reinforces the emotion–cognition–behavior model. By continuously detecting and responding to visitor emotions, the system dynamically adjusts exhibit content and interactive elements, thereby fostering deeper emotional resonance and engagement. This demonstrates the pivotal role of emotion as a bridge between cognition and behavior in human–space interactions. By applying EC in museum spatial optimization, this study provides new empirical evidence supporting the theoretical significance of emotion in interactive design, and advances our understanding of human–environment emotional dynamics.
The results of this study demonstrate that the AI-driven museum space optimization model significantly enhances both visitor engagement and emotional resonance. These findings align with several theoretical frameworks across disciplines. First, the increase in Exhibition Liquidity from 70 to 88% supports the “Space Syntax” theory proposed by Yanmaz et al.56which posits that dynamic path planning improves spatial readability by reducing topological complexity. Unlike the linear layouts typical of traditional museums, the RL model employed here adopts a non-deterministic spatial structure, as advocated by Yanmaz et al. Its multi-path navigation system—featuring personalized route recommendations—not only minimizes redundant movement but also encourages exploratory behavior among visitors. Second, the affective computing-driven enhancement of interactive experiences aligns closely with Zhang et al.’s “emotion–cognition–behavior” triadic model57. When the system detects positive emotional responses from visitors, it dynamically deepens exhibit content, for example, by overlaying AR-based historical reconstructions. This adaptive approach adjusts cognitive load based on user feedback, effectively enabling emotion-driven content engagement. Third, the advantages of VR/AR exhibition formats in promoting knowledge retention and task efficiency echo Holler’s concept of “embodied interaction”58. Multimodal inputs—such as gestures, touch, and vision—help encode long-term memory by coupling bodily actions with cognitive processes. However, the study also highlights potential risks associated with technology use. Over-reliance on emotional feedback may lead to the creation of “information cocoons,” where visitors are repeatedly exposed only to content that aligns with their existing preferences. This concern mirrors Torres-Ruiz et al.’s critique of algorithmic recommendation systems59. To mitigate this, future research should explore mechanisms that balance personalization with diversity—such as integrating “exploration incentives” to motivate visitors to engage with unfamiliar content. Finally, the system’s processing latency was rigorously tested and optimized to ensure it did not impair user experience. Through the use of efficient algorithms and optimized hardware configurations, average response time was maintained below 100 milliseconds—well under the human threshold for perceiving interaction delay. User perception tests further confirmed that visitors did not notice any significant lag during operation, demonstrating that the system meets real-time interaction requirements for practical deployment.
The process of using affective computing to identify and respond to audience emotions inevitably raises concerns about privacy and ethics. Although this study adhered to strict ethical guidelines and obtained written informed consent from participants during the experimental phase, the broader deployment of continuous emotion monitoring may introduce potential ethical and privacy risks. To address these challenges, several measures should be taken. First, audiences must be clearly informed about the purpose of emotional data collection and how the data will be used, ensuring they have full knowledge and the right to choose whether to participate. Second, data anonymization and encryption technologies should be employed to safeguard audience privacy and prevent emotional data from being leaked or misused. Third, robust data governance and oversight mechanisms must be established to regulate and monitor the collection, storage, and use of emotional data, ensuring full compliance with ethical standards and legal requirements. During data collection for model training, particular attention was paid to diversity and representativeness, encompassing audience demographics such as age, gender, and cultural background. In the future, the model should undergo regular evaluation and validation to monitor performance across different groups. If any biases are identified, model parameters will be adjusted or algorithms optimized accordingly. Additionally, regular feedback sessions with museum staff and visitors are planned to promptly identify and resolve issues arising from algorithmic behavior, ensuring fairness and equity in system deployment.
High-density visitor flow and a diverse range of exhibit types may impose increased demands on system performance and stability. To meet these challenges, a distributed computing architecture and cloud technologies can be adopted, distributing computational tasks across multiple server nodes to enhance processing capacity and scalability. In large-scale application scenarios, techniques such as data sampling, data compression, and incremental learning can be utilized to reduce storage and processing burdens. Cloud platforms can also leverage elastic scaling, automatically allocating additional computational resources during peak visitor hours and releasing them during off-peak times to reduce operational costs. The CV module can be scaled by increasing the number of cameras and sensors in response to exhibit complexity and quantity. The affective computing module can be extended to support more emotional dimensions and expression modalities. The RL module can adapt its optimization strategies and algorithms based on the museum’s scale and complexity. By analyzing both historical and real-time data, the system can forecast visitor traffic at different times, proactively adjusting spatial layouts and interactive content to disperse crowds and reduce congestion.
Within the Chinese cultural context, audiences may prefer group visits and interactive social experiences, whereas Western cultures often emphasize individual exploration and quiet reflection. To accommodate these differences, the proposed model can adjust its parameters and strategies to suit distinct cultural preferences. In cultures that prioritize personal experience, more individual interaction zones and immersive activities can be introduced. In cultures that value group interaction, spatial layouts can be optimized to include communal activity areas and collaborative installations. Furthermore, emotional expression varies across cultures—some may lean toward more reserved displays, while others exhibit emotions more openly and directly. By incorporating culturally diverse training data, the accuracy and adaptability of emotion recognition can be improved, ensuring that the system captures and responds to the emotional dynamics of audiences from various cultural backgrounds effectively.
Conclusion
This study integrates RL, CV, and affective computing to develop a dynamic and adaptive model for museum space optimization. Experimental results demonstrate significant improvements in spatial fluidity (by 21.5%), exhibit visitation rate (by 58.3%), and visitor satisfaction (scoring 88.6 points). The core innovation lies in the real-time, collaborative optimization of space, content, and emotion. Compared to traditional designs, the AI-driven layout not only reduces congestion (from 18 to 5%) but also enhances personalized and in-depth interactions through multimodal emotion recognition (facial expressions, voice, and body posture). However, the model’s generalizability remains constrained to specific scenarios, such as high-density special exhibitions, and dynamic spatial changes may disorient some visitors. Future research will address three key directions: (1) establishing a transfer learning framework to test the model’s adaptability in both large comprehensive museums and themed institutions; (2) investigating unsupervised affective computing methods to reduce dependence on labeled emotional data; and (3) integrating metaverse concepts to construct a distributed exhibition network that bridges virtual and physical spaces, thereby extending the narrative boundaries of traditional museum environments. This study not only achieves intelligent optimization of exhibition space on a technical level but also validates the applicability of key theoretical frameworks—such as space syntax theory and the emotion-cognition-behavior model—in the museum context. The explicit integration of these theories provides a solid academic foundation for the findings and offers valuable theoretical guidance for future interdisciplinary studies at the intersection of AI and cultural heritage. By combining AI technologies with theories from environmental psychology and human-computer interaction, this study highlights the potential of cross-disciplinary approaches in addressing complex real-world challenges. These insights contribute not only to the field of museum space design but also offer broader implications for architecture, urban planning, and educational technology.
Looking ahead, future research can be expanded in the following directions: First, develop lightweight model architectures by integrating edge computing technologies to reduce hardware dependency. In parallel, explore cross-scenario transfer learning frameworks to improve the model’s adaptability across exhibition spaces of varying scales. Second, incorporate a user diversity analysis module to support inclusive and personalized interaction. Design tiered interaction strategies based on multidimensional user attributes such as age, cultural background, and physical ability. For instance, implement gamified guided tours for children, and develop audio–tactile integrated feedback systems for visually impaired visitors. Third, investigate pathways for sustainable development. Combine AI-based optimization with green building strategies. For example, use real-time crowd forecasting to dynamically adjust lighting and climate control systems within exhibition halls, thereby reducing energy consumption. Fourth, emphasize the ethical implications of technology deployment. Establish transparent data usage policies and robust privacy protection mechanisms to mitigate the risks of algorithmic bias and “information narrowing,” where users are exposed only to preferred or familiar content. The theoretical framework established in this study provides a new foundation and direction for future exploration. Building on this work, future research can further examine the potential of AI in the protection and dissemination of cultural heritage. By leveraging advanced technologies, scholars and practitioners can gain deeper insights into the interaction between humans and designed spaces—ultimately contributing to the ongoing innovation and sustainable transmission of cultural values.
Related Posts