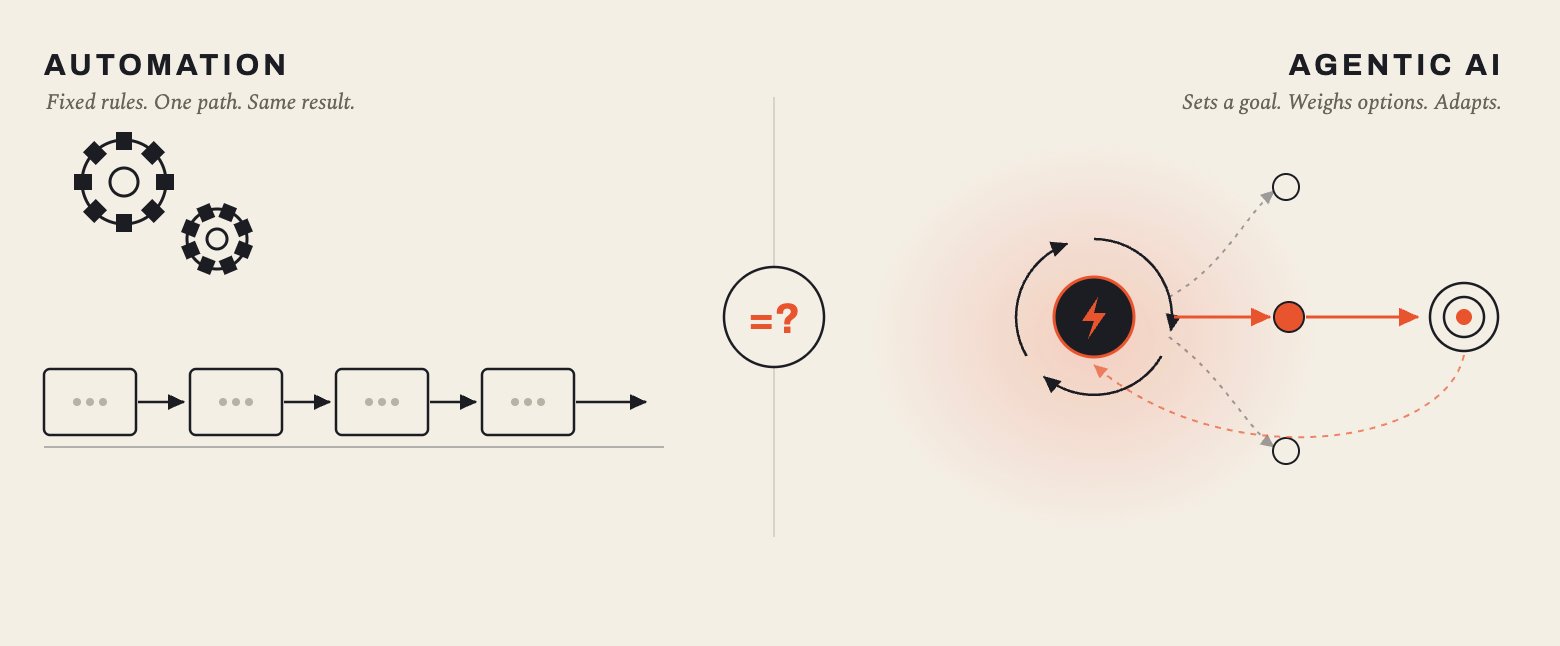
FlowX.AI is among the first partners bringing specialized industry agents to Gemini Enterprise, with enterprise-grade AI built for complex, high-stakes work where making a mistake is not an option. FlowX.AI today announced that specialized FlowX.AI agents are available through Google Cloud Marketplace and as part of Gemini Enterprise, enabling Gemini Enterprise customers to bring AI into
Clinical validation pipeline of a deep learning model for segmenting and quantifying intracranial and ventricular volumes on computed tomography – Scientific Reports
Introduction
The increasing availability of noninvasive imaging techniques such as magnetic resonance imaging (MRI) and computed tomography (CT) has led to higher demand for these services. Their widespread use for routine check-ups and early detection strategies has significantly increased the need for radiologists to interpret these exams. This demand is further exacerbated by the shortage of radiologists, making it challenging to keep pace with the rising prevalence of age-related diseases and the emphasis on preventive care by healthcare systems1,2,3.
Despite the wide range of CT and MRI applications, their interpretability depends on the availability of experts. The lack of trained radiologists, especially in resource-limited regions, can hinder access to proper diagnosis. Recent advances in artificial intelligence (AI) and deep learning (DL) offer promising solutions. AI/DL algorithms have proven to be useful tools that assist radiologists in interpreting various medical images and serve as clinical decision support systems4,5,6,7. Unlike traditional machine learning, which relies on predefined features, DL uses artificial neural networks that can automatically learn complex patterns directly from large amounts of image data. This eliminates the need for manual feature engineering and allows models to handle nuanced details, improving accuracy in segmentation, classification, and anomaly detection tasks. This versatility allows DL to excel at various tasks in the radiology workflow5,6,7,8,9.
While most AI-based solutions focus on MRI8, CT offers several advantages, including being generally less time- and resource-intensive while widely available, which can be particularly advantageous in developing regions with high demand or limited specialist access10. In neuroradiology, for example, automatic detection of image abnormalities can expedite patient triage and ensure timely treatment of patients with potentially lethal or debilitating conditions9. By detecting subtle abnormalities and critical findings such as ischemic stroke and intracranial hemorrhage, DL can streamline CT scan reading and prioritize critical findings, leading to faster diagnosis9,11,12,13. In addition, by automating time-consuming brain measurements and segmenting brain regions, including multiregional analysis14 and specific areas of interest15, DL can provide neuroradiologists with quantitative tools for detecting and monitoring disease. Understanding the brain’s volume and structure is fundamental for neurological research and diagnosing various brain diseases. Two measures that are useful in this context are the intracranial volume (ICV) and the lateral ventricular volume (LVV)16.
The ICV represents the total space occupied by the brain, its protective membranes (meninges), and cerebrospinal fluid within the skull, excluding the spinal cord. Measuring ICV is important for several reasons. First, ICV allows researchers to normalize brain volume measurements, distinguishing true variations in brain tissue volume from differences in head size. This is particularly important when studying the relationship between ICV and various neurological and psychiatric conditions17,18,19. Second, ICV is the most widely used proxy for “brain reserve,” the brain’s capacity to withstand damage or disease20. Third, ICV measurement is valuable in diagnosing and monitoring conditions that affect cranial volume, such as microcephaly and craniosynostosis (premature skull fusion), as well as an indirect measure of brain growth in children. The ICV is also helpful in other contexts, e.g., in the postoperative assessment of craniofacial surgery and anthropological and forensic examinations19,21,22. Extracting ICV, also known as skull stripping or brain extraction, typically involves removing the skull and extracranial soft tissues from CT and MRI scans. This skull-stripping process is crucial in many neuroradiology pipelines, facilitating accurate ICV measurement and allowing for further brain structure analysis by removing irrelevant details23,24.
The LVV, which corresponds to the summed volume of the lateral ventricles, holds significant importance for diagnosing and monitoring various diseases. Its enlargement is frequently observed in neurodegenerative diseases and hydrocephalus, indicating brain atrophy or cerebrospinal fluid accumulation25,26. Thus, quantifying the LVV provides valuable objective data for diagnosis, allowing physicians to assess and follow the degree of abnormality. In addition, monitoring changes in ventricular volume over time allows disease progression to be tracked and treatment plans to be adjusted accordingly15,27. Serial imaging methods are used to monitor initial ventricular size and subsequent changes. Significant ventricular enlargement is readily detectable, but subtle, incremental changes can be difficult to appreciate visually. However, using quantitative LVV measurements, even small changes can be captured and tracked, providing a more sensitive and objective assessment of disease progression or treatment response26,28.
Segmentation methods can generally be categorized as automated, semi-automated, or manual. Although manual segmentation is considered the gold standard for volumetric quantification of regional brain structures, it becomes laborious, time-consuming, and operator-dependent when dealing with larger datasets29,30. Researchers have explored automated methods based on image analysis techniques to tackle this issue, including DL models and classical image processing17. In clinical practice, the assessment of ICV and LVV is primarily subjective or based on two-dimensional indices, while three-dimensional measurements are rarely used. This reliance on subjective assessment or limited dimensional analysis makes the procedure prone to variations and inaccuracy16,27,31. Automated, quantitative assessment of ICV and LVV offers a more objective and standardized approach to diagnosis, potentially enhancing accuracy and consistency in one-time evaluation and enabling numerical comparative monitoring over time32.
This study aims to establish a clinical validation pipeline for DeepCTE3D (Deep Convolutional Neural Network for Computed Tomography Extraction 3D), a previously developed DL-based model that segments and quantifies intracranial volume (ICV) and lateral ventricular volume (LVV) in CT scans using a three-dimensional architecture. The validation was conducted using an anonymized, diverse database from a large private hospital in Brazil. We also implemented a robust and scalable ground-truth mask generation process based on open-source tools, in which annotators segmented regions of interest and experts validated the resulting masks. Secondary analyses examined the influence of patient sex, CT scanner model, and the presence of radiological findings on model performance.
Methods
Dataset
Dataset creation
Consecutive non-contrast head CT scans performed in February 2021 on different scanners at Hospital Israelita Albert Einstein, a large tertiary hospital in Brazil, were retrospectively included in this study. Scans were excluded if they lacked thin-section image series (i.e., pixel spacing less than or equal to 1.3 mm), had significant imaging artifacts, or were missing metadata on age and sex. Scans were deidentified using the Radiological Society of North America Clinical Trial Processor, with customized scripts to retain the relevant DICOM (Digital Imaging and Communications in Medicine) tags for serial identification, patient age, and sex. This study was approved by the institutional ethics committee (CAAE: 52257521.8.0000.0071), and the need for informed consent was waived (IRB Hospital Israelita Albert Einstein). All methods were performed in accordance with the relevant guidelines and regulations.
Patients
The study involved 481 patients, yielding 481 different scans. The median age of the patients was 48 ± 36 (interquartile range) years, with a range of 0 to 100 years. 214 (44.49%) were male and 267 (55.51%) were female. Most scans were obtained with a single scanner model (48.60%), and the FC21 kernel was the most commonly used (81.10%) (Table 1).
Dataset preprocessing
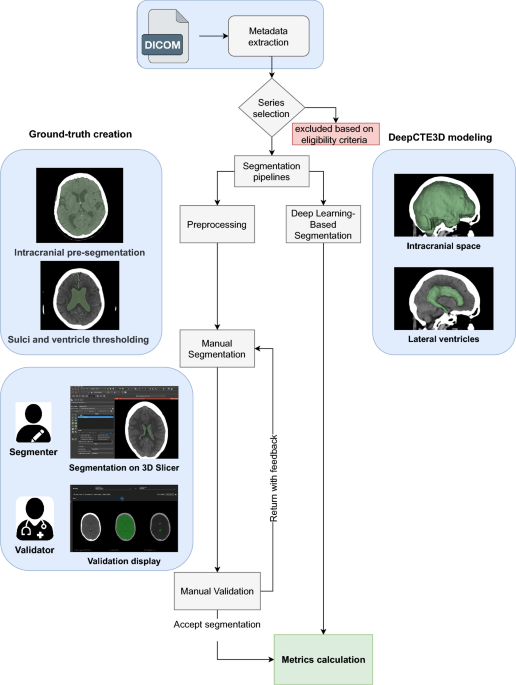
First, metadata are extracted from all series of a given exam. This allows the exclusion of series that do not meet the inclusion criteria and the selection of series with thin-section images and a soft-tissue filter.
Once the target series has been selected, it is segmented via two different pipelines: manual and automatic segmentation. The manual segmentation process involves a three-step approach designed to facilitate the identification of structures and ensure the quality of the resulting volume, which is considered the ground-truth (GT). The automatic segmentation is performed by DeepCTE3D.
Creation of ground-truth annotations
Preprocessing
Ground-truth creation relies on tedious manual work requiring high operator attention. To reduce this workload, the selected image series is automatically preprocessed before manual GT segmentation.
First, a Gaussian filter is applied to smooth the images and reduce noise, facilitating the detection of structures. This is particularly important for segmenting the ventricles, as noise can hinder the recognition of their boundaries.
For ICV segmentation, we developed a pre-segmentation heuristic that utilizes a series of operations such as thresholding, erosion, largest connected component selection, and dilation to identify the intracranial region. The images and corresponding ICV segmentations are then transmitted to a remote storage service, which subsequently sends the information to a database. A detailed explanation of the heuristics used can be found in the Supplementary Material.
Segmentation
Ten researchers with health science backgrounds executed the image segmentation process. They used a web-based version of 3D Slicer33,34,35,36. This tool streamlines access to the image list and assigns an ICV or LVV segmentation task to the user slice by slice. The system automatically manages task assignments. Once segmentation is complete, the results are uploaded to a remote storage service for neuroimaging experts to access.
Validation
A team of five board-certified radiologists with a median of 6 years (range 4–9) of experience validated the GT masks. The validators were responsible for approving the annotations and determining whether the original segmentation could be used for the model or needed to be sent back for re-evaluation by the segmenters, including written feedback. This platform was developed using the Trame framework37 and PostgreSQL database38. An interobserver agreement study was conducted as described in Subsection “CT reports annotation”.
Deep learning model
We present a validation pipeline for DeepCTE3D, a model for the ICV and LVV segmentation described by Moraes et al.39. Their work introduced a novel architecture, И-Net, for segmenting these structures, with preprocessing steps including reorientation to the LAS standard, resizing to 256 x 256 x 256 dimensions, and windowing with a range of (-15) to 100 Hounsfield units. Additionally, data augmentation techniques such as grid and optical distortions, flipping, transposition, and 90- and 30-degree random rotation were employed to increase the variability of the training dataset before feeding it into the model. Although the eyeballs were also segmented during training, they were not included in the retrospective validation, as this task served as an auxiliary method to improve the segmentation of ICV and LVV structures39. The DL model was previously trained on an independent dataset comprising 441 head CT scans, with 30 scans used for validation and 88 for testing, achieving Dice scores of 98.13% for intracranial space and 80.76% for lateral ventricles39.
Retrospective clinical validation analysis
The validation of DeepCTE3D was performed by systematically comparing the predictions of this model with ground truth (GT), i.e., ICV and LVV segmented by health science researchers and validated by trained radiologists. This involved the development of a pipeline to ensure accuracy and reliability, detailed in Fig. 1 and in the following sections. An explanatory video can be found in the Supplementary Video S1. The development of DeepCTE3D, including its preprocessing techniques, has been published elsewhere39.
Retrospective clinical validation pipeline. DICOM head CT scans undergo metadata extraction, series selection, and exclusion of ineligible cases. Ground-truth creation involves preprocessing, intracranial pre-segmentation, manual segmentation in 3D Slicer, and expert validation with feedback. In parallel, DeepCTE3D performs deep learning–based segmentation of the intracranial space and lateral ventricles. Accepted segmentations are then used to calculate performance metrics.
This pipeline processes a dataset of DICOM exams. Exams within the dataset can comprise several series, each containing images in different planes, filters, and slice thicknesses of the patient’s head.
Evaluation metrics
After validation, the resulting masks were classified as GT, to which the segmentations created with DeepCTE3D were compared. This comparative analysis involved the volume measurements for each structure represented in both sets of images, as well as the calculation of the Dice coefficient, the Jaccard coefficient, and the Hausdorff distance. Performance metrics were calculated using Python version 3.9.2 (Python Software Foundation)40.
CT reports annotation
Of the 481 scans used for DeepCTE3D validation, 474 had official reports that were retrospectively subjected to multilabel classification. This step was performed after the validation of the segmentation masks and was not part of the main pipeline. Seven radiology residents categorized these reports into nine categories to enable an exploratory, stratified evaluation of DeepCTE3D’s performance metrics for ICV and LVV. The categories comprised ischemic stroke, midline shift, mass effect, fractures, intra-axial hemorrhage, extra-axial hemorrhage, hydrocephalus, other non-critical findings, and scans within normal limits. Each report was independently annotated by two residents, and any discrepancies were resolved through adjudication by a neuroradiologist with five years of experience.
Statistical analysis
Continuous variables were summarized using medians and interquartile ranges (IQR), with normality assessed by visual inspection of quantile plots. Categorical variables were described as frequencies and percentages. Agreement among the five radiologists in defining the ground truth (GT) for ICV and LVV was evaluated using Gwet’s AC1 coefficient41, with 95% confidence intervals. Agreement strength was interpreted according to the Landis and Koch criteria42.
To assess the influence of image characteristics on segmentation performance and volumetric measures, we applied a two-tailed Kruskal–Wallis test. Effect size was quantified using the (eta ^2) statistic43,44. When appropriate, pairwise comparisons were performed using the Wilcoxon rank-sum test with Holm–Bonferroni correction, and effect sizes were calculated using the r statistic43.
Agreement between DeepCTE3D-derived and manually measured ICV and LVV values was evaluated using Bland–Altman analysis with 95% limits of agreement, expressed as a percentage of the measured values. Systematic differences were assessed using the Wilcoxon signed-rank test, with effect size estimated by the r statistic. Differences in bias across scanner models and patient sex were assessed using the Kruskal–Wallis test.
All hypothesis tests were two-tailed with a significance level of 5%. Statistical analyses and graphical representations were performed using R version 4.3.1 (The R Foundation for Statistical Computing, Vienna, Austria).
Results
Full size table
Ground truth annotation analysis
Interobserver agreement
The five radiologists independently validated 80 scans. The Gwet AC1 coefficient resulted in 0.78 [0.70;0.87] for the ICV and 0.71 [0.62;0.80] for the LVV. Following Landis’s criteria, the agreement was substantial for both regions.
Distribution of intracranial and ventricular volumes by covariates
The intracranial GT masks produced from 481 exams resulted in a median volume of 1,365.92 ± 196.95 (hbox {cm}^{3}). For the lateral ventricles, the median value was 16.45 ± 20.04 (hbox {cm}^{3}) (Table 2). When we considered the patients’ sex, we observed that females presented significantly smaller intracranial volumes (ICV) (p < 0.001, (eta ^2 = 0.38)) and ventricular volumes (LVV) (p = 0.003, (eta ^2 = 0.02)) compared to males (Supplementary Table S1 and Supplementary Fig. S1). The ICV and LVV for females showed a median value of 1,284.23 ± 146.39 (hbox {cm}^{3}) and 14.76 ± 16.60 (hbox {cm}^{3}), respectively, while the volumes of both structures for males were 1,452.57 ± 152.71 (hbox {cm}^{3}) and 18.82 ± 26.57 (hbox {cm}^{3}). The scanner model had an effect only on ventricular volumes (p < 0.001, Supplementary Table S2 and Supplementary Fig. S2).
Full size table
AI-derived annotations analysis
Distribution of intracranial and ventricular volumes by covariates
For the intracranial and ventricular masks produced by DeepCTE3D, we observed a median ICV of 1,377.36 ± 197.06 (hbox {cm}^{3}) and a median LVV of 18.38 ± 23.20 (hbox {cm}^{3}) (Table 2). When we considered the sex of the patients, we observed that the model produced intracranial masks with median volumes of 1,294.02 ± 150.36 (hbox {cm}^{3}) for females and 1,464.42 ± 151.49 (hbox {cm}^{3}) for males (p < 0.001, (eta ^2 = 0.36), Supplementary Table S1 and Supplementary Fig. S3). The ventricular masks had median volumes of 16.47 ± 17.84 (hbox {cm}^{3}) for females and 20.2 ± 28.78 (hbox {cm}^{3}) for males (p = 0.02, (eta ^2 = 0.01), Supplementary Table S1 and Supplementary Fig. S3). CT scanner model also had an effect on the ventricle’s volumes (p < 0.001, Supplementary Table S2 and Supplementary Fig. S4).
Ground truth vs AI-derived annotations analysis
Quantitative results
DeepCTE3D-generated intracranial masks had a median Dice similarity of 0.989 ± 0.002 and a median Hausdorff distance of 9.00 ± 4.65 with the GT. Of the 481 intracranial masks evaluated, 470 (97.71%) had a Dice similarity of at least 0.98 with the GT (Fig. 2). Considering ventricular segmentations, we observed a Dice similarity of 0.84 ± 0.09 and a Hausdorff distance of 34.60 ± 13.96. (Fig. 3). Of the 481 masks evaluated, 456 (94.80%) had a similarity of at least 0.70 with the GT.
Intracranial Metrics. (a) Dice Score for intracranial volume across patient age. (b) Dice Score for intracranial volume across patient sex. (c) Hausdorff Distance for intracranial volume across patient age. (d) Hausdorff Distance for intracranial volume across patient sex. Green lines represent (Q_{75%} + 1.5 IQR) and (Q_{25%} – 1.5 IQR). Orange and blue colors across all graphs indicate female and male patients, respectively.
Ventricular Metrics. (a) Dice Score for lateral ventricular volume across patient age. The upper limit of the outlier calculation (75th percentile + 1.5 interquartile range) was above one and was therefore not shown in the graph. (b) Dice Score for lateral ventricular volume across patient sex. (c) Hausdorff Distance for lateral ventricular volume across patient age. (d) Hausdorff Distance for lateral ventricular volume across patient sex. Orange and blue colors across all graphs indicate female and male patients, respectively.
When we analyzed the effect of the sex covariate on similarity and distance metrics, we observed that for the Dice similarity metric, the effect was statistically significant in both intracranial (p = 0.03, (eta ^2 = 0.01)) and ventricular (p < 0.001, (eta ^2 = 0.02)) structures (Figs. 2 and 3). However, the effect size was equal to or less than 0.02 (Supplementary Table S6). For the scanner models, we observed a statistically significant effect on Dice (p < 0.01, (eta ^2 = 0.04)) and Hausdorff (p = 0.03, (eta ^2 = 0.02)) for ICV metrics (Supplementary Fig. S7). For LVV metrics, we only observed a statistically significant effect on ventricular Dice (p < 0.01, (eta ^2 = 0.04)). However, the magnitudes of these effects were all classified as small (Supplementary Table S7 and SFig. 8). Box-plots regarding Dice scores across scanners are shown in Fig.4.
Dice score across scanners for intracranial and lateral ventricles segmentation.
When we investigated the relative volume differences between the DeepCTE3D-generated and GT masks, considering the covariates of sex and scanner model, we found that both factors significantly influenced these differences in ICV and LVV. However, the scanner model covariate had a larger effect size than the sex covariate. Specifically, the effect size of the scanner model covariate was considered moderate for ICV and large for LVV (Supplementary Tables S3, S4, and S5 and Supplementary Figs. S5 and S6). For ICV, the bias between males and females was 0.37% and 0.82% (p < 0.001, (eta ^2 = 0.03)), respectively. Regarding LVV, the biases were 5.93% and 10.97% (p = 0.004, (eta ^2 = 0.02)). Although the differences indicate a larger bias for female patients, the effect sizes were small.
When analyzing the bias according to the scanner model, the Aquilion and Aquilion PRIME scanners showed the highest bias for ICV (0.98% and 0.86%, Supplementary Fig. S7) and LVV (10.03% and 18.16%, Supplementary Fig. S8, Tables S8 and S9). The Bland-Altman 95% limits of agreement between DeepCTE3D and GT was 0.62 ± 3.40% (p < 0.001, r = 0.73) for ICV (Fig. 5) and 8.73 ± 21.62% (p < 0.001, r = 0.44) for LVV (Fig. 6). These results showed that DeepCTE3D tends to overestimate both ICV and LVV. Bland–Altman plots stratified by scanner type are presented in Supplementary Figures S9 and S10.
Bland-Altman plot assessing agreement between DeepCTE3D-generated and ground-truth intracranial volumes. The blue lines represent the limits of agreement, the green line represents the mean of differences, and the black lines represent the 95% confidence intervals. Orange and blue colors indicate female and male patients, respectively.
Bland-Altman plot assessing agreement between DeepCTE3D-generated and ground-truth ventricular volumes. Orange and blue colors indicate female and male patients, respectively.
Qualitative results
We compared representative examples of DeepCTE3D’s performance, including both successful and poor segmentations, by analyzing the symmetric differences and intersection between the two masks: one generated by DeepCTE3D and the other representing GT (Figs. 7 and 8 and Supplementary Figs. S12, S13, and S14). In examining the 27 cases identified as outliers by the Bland-Altman analysis for both ICV and LVV masks, we conducted a thorough visual inspection to uncover potential causes of segmentation disparities. This investigation revealed that preexisting medical conditions, such as hydrocephalus (4 scans, 14.82%) and severe white-matter disease (5 scans, 18.52%), may have adversely affected the model’s tissue discrimination capabilities. Most outliers (17 scans, 62.96%) were classified by radiologists as normal.
Successful model segmentation: Selected slices from the ground-truth mask (blue) compared to the corresponding slices of the DeepCTE3D-generated mask (red). The intersection column (green) shows a high degree of agreement. Data from an 81-year-old female patient. ICV was 1,372.30 (hbox {cm}^{3}) (ground truth) and 1,384.86 (hbox {cm}^{3}) (DeepCTE3D), with Dice and Hausdorff values of 0.99 and 7.20, respectively. LVV was 149.40 (hbox {cm}^{3}) (ground truth) and 156.92 (hbox {cm}^{3}) (DeepCTE3D), with Dice and Hausdorff values of 0.95 and 10.15, respectively. Yellow arrows point to the areas of difference.
Poor model segmentation: Selected slices from the ground-truth mask (blue) compared to the corresponding slices of the DeepCTE3D-generated mask (red) in a 76-year-old male patient. Areas of poor model performance are highlighted in the difference column (blue and red). In this patient, these areas could be attributable to hydrocephalus, enlarged brain sulci and fissures, and white-matter hypoattenuation. Interestingly, these differences are also seen in regions without obvious parenchymal pathology, with a clear predominance on the right side. ICV was 1,574.83 (hbox {cm}^{3}) (ground-truth) and 776.05 (hbox {cm}^{3}) (DeepCTE3D), with Dice and Hausdorff values of 0.66 and 52.46, respectively. LVV was 302.10 (hbox {cm}^{3}) (ground-truth) and 150.55 (hbox {cm}^{3}) (DeepCTE3D), with Dice and Hausdorff values of 0.62 and 24.44, respectively.
CT findings on the dataset
Among the analyzed reports (N = 474), radiology residents reached consensus in 353 cases, while the remainder were adjudicated by an experienced neuroradiologist. Most examinations were classified as non-critical findings (n = 270) or normal (n = 177). Less frequent findings included extra-axial hemorrhage (n = 20), mass effect (n = 9), fractures (n = 8), ischemic stroke (n = 6), hydrocephalus (n = 4), intra-axial hemorrhage (n = 4), and midline shift (n = 1). As patients could present multiple findings, the total number of findings (N = 499) exceeded the number of exams.
To evaluate the impact of radiological findings on volumetric measurements, intracranial and ventricular volumes, as well as Dice scores and Hausdorff distance, were compared across CT labels. Box plots illustrating volumetric differences are presented in Supplementary Fig. S11, with corresponding descriptive statistics provided in Supplementary Tables S10–S14.
A statistically significant difference was observed only for the LVV Dice coefficient, between non-critical findings and normal scans (Supplementary Tables S15–S18). Despite the class imbalance, model performance remained consistent across categories.
Discussion
In this study, our objective was to validate a previously developed DL model, DeepCTE3D, in a real-world scenario for the segmentation and quantification of ICV and LVV in head CT scans. We utilized a large dataset that includes variations in clinical conditions, sex, age groups, and scanner models. While prior studies have proposed DL-based methods for ICV and LVV segmentation15,16, and recent frameworks such as SynthSeg45 and nnU-Net46 have achieved state-of-the-art results in brain segmentation, these have rarely been validated on diverse or large-scale CT datasets using multiple performance metrics. Our study addresses this gap by assessing DeepCTE3D across multiple scanner vendors, acquisition protocols, and a spectrum of normal and pathological cases, reflecting the variability encountered in routine clinical settings.
We hypothesized that DeepCTE3D would produce masks comparable to GT. The results confirmed this hypothesis, demonstrating that the Dice similarity coefficient for ICV segmentation was near-perfect (0.99 ± 0.002) compared to GT. However, the Dice similarity coefficient for LVV segmentation was modestly lower (0.84 ± 0.09). This difference in performance can be attributed to the inherent anatomical complexity of the lateral ventricles compared to the intracranial space: while the latter is a relatively uniform, rounded volume, the precise segmentation of the LVV requires the delineation of complex, interconnected structures. In addition, the lateral ventricles have attenuation values similar to those of the surrounding parenchyma. In contrast, the intracranial space is bounded by the bony skull, which has a significantly different attenuation value, facilitating segmentation compared to the LVV. Because our pipeline used nearest-neighbor upsampling to preserve discrete masks–appropriate for binary segmentation but prone to boundary pixelation in small structures–future work could explore sliding-window inference at native resolution, trilinear upsampling of logits with binarization, and boundary-aware losses to improve small-structure delineation46,47,48. These adjustments are particularly relevant for LVV, where small and irregular boundaries are more susceptible to voxelization artifacts and partial-volume effects. By combining higher-resolution inference with smoother logit interpolation and contour-sensitive losses, future implementations could enhance boundary fidelity without compromising label integrity.
Research on DL-based models for segmenting ICV and LVV on CT is currently scarce, particularly for ICV8,15,16. Our results contribute to this evidence base and align with previous studies15,16,49,50. Maragkos et al.16 described a DL model with similar objectives and reported Dice coefficients of 0.983 (ICV) and 0.878 (LVV) using a considerably larger dataset (13,851 patients), indicating performance comparable to ours despite the scale difference. Other groups have also described high Dice for ventricular segmentation, but typically in more constrained settings that differ from ours in aims, cohorts, and endpoints. For example, Huff et al.30 achieved 0.92 for the lateral ventricles (and 0.79 for the third ventricle) using relatively homogeneous scanners/acquisition and largely non-pathologic ventricles, and argued that longitudinal consistency may be more clinically meaningful than absolute volumes. Klimont et al.51 reported high Dice (0.95) in a pediatric hydrocephalus cohort with single-vendor protocols, which limits generalizability to adult, mixed-pathology settings. Finally, Zhou et al.52 studied elderly patients across CT/MRI and a range of slice thicknesses, reported Dice > 0.9, and noted that thicker slices degrade accuracy–reinforcing the importance of acquisition variability. In contrast, our Phase I, real-world validation reports per-scan Dice and Hausdorff distances against radiologist-validated masks in an unselected adult cohort spanning multiple vendors, reconstruction kernels, and slice thicknesses, and explicitly examines scanner-related effects on relative volume–a dimension largely not addressed in prior studies.
DeepCTE3D’s potential goes beyond diagnostic applications, particularly in its ability to segment the ICV, also known as skull stripping. This procedure constitutes a fundamental initial step within established neuroimaging analysis pipelines. Skull stripping improves image registration accuracy, especially in linear methods, by excluding anatomical structures prone to non-rigid deformations, such as the scalp, eyeballs, and ears. This selective tissue removal improves registration accuracy by focusing on the brain parenchyma, a region characterized by more consistent anatomical landmarks. Traditionally, skull stripping techniques have primarily concentrated on MRI data. However, DeepCTE3D demonstrates exceptional performance on CT, expanding its potential applications within neuroimaging workflows. In addition, this technique contributes to data anonymization by eliminating facial details23,24,53.
When comparing sex differences between the DeepCTE3D and GT masks, a discrepancy was noted in the Dice metric between sexes, but not for the Hausdorff distance. However, the effect size was small across all comparisons, with the largest effect observed in the ventricles. These findings suggest that subtle sex differences in Dice metrics may be attributed to variations in the size of the segmented structures, as female ventricles are typically smaller, confirmed by both DeepCTE3D-generated and GT masks54,55,56,57,58 and that Hausdorff distance, which is less sensitive to object size, showed no significant sex-related differences.
DeepCTE3D also exhibited a slight tendency to overestimate ICV and LVV. This may be attributed to variations in the protocols used to create the GT data for this retrospective clinical validation described in the Methods section and in the Supplementary Material. This differed from the more variable protocol used during the model training, where the user manually contoured the ventricles in each image slice. The newly implemented segmentation protocol still relies on manual work, but it has standardized the creation of a pre-segmentation for ICV and reduced the manual workload by streamlining the organization and management of annotations through a PostgreSQL database for both ICV and LVV segmentations. In addition, differences arise from post-processing techniques applied to the model’s output. While manual segmentation operates at the original image resolution, typically 512x512x512, DeepCTE3D expects input images sized at 256x256x256, resulting in output segmentations of the same dimensions. To match the original image size, the output segmentation undergoes oversampling using the nearest neighbor interpolator, which can lead to a blocky or pixelated surface59. This segmentation discrepancy contributes to volume differences between the GT and DeepCTE3D-generated segmentation, which is more pronounced for scanners with higher resolution due to aliasing errors, i.e., artifacts that arise from sampling and consequent loss of information60, and for LVV than ICV. This occurs because the LVV is smaller than the ICV. Therefore, it is more susceptible to pixelation effects in segmentation. However, the overestimation was minor and probably clinically irrelevant.
Interestingly, when analyzing the Bland-Altman results according to sex, we observed a trend of higher overestimation in female patients. This could be partially explained by an imbalance in the training dataset, where only 13.6% of the patients were female39. Although the performance across pathological and normal scans–according to their report classifications–was encouraging, the relatively small number of cases for each condition (e.g., different subtypes of intracranial hemorrhage, midline shift, and hydrocephalus) limits the representativeness and statistical power of these results. Retraining DeepCTE3D with a more balanced dataset, particularly for sex and pathological categories, may improve future accuracy.
Furthermore, this study explored the impact of the scanner model on DeepCTE3D’s performance. Although a statistically significant difference was observed in all metrics except LVV Hausdorff, the magnitude of the effect was small in all metrics (Supplementary Table S7 and Fig. S8). This suggests that while variations between acquisition parameters may have a detectable influence, their practical impact could be minimal. In particular, the Biograph 40 and Discovery 60 scanner models, which exhibited the lowest performance in ICV segmentation, also featured the largest pixel spacing (z-axis) and slice thickness compared to other models (Supplementary Figs. S7 and S8 and Supplementary Table S8). These larger pixel spacing and thicker slice thickness result in images with lower resolution and blurred boundaries, which affects the ability of the segmentation algorithm to distinguish between different tissues. In addition, thicker slices can miss subtle anatomical variations, especially in structures that span multiple slices. When considering the relative volume differences between DeepCTE3D-generated and GT masks, the scanner model covariate significantly influenced these relative differences, with a moderate effect size for ICV and a large effect size for LVV. These moderate-to-large effects warrant targeted follow-up to determine whether they translate into clinically meaningful differences. The observed LVV mean overestimation ((tilde{8}.73%) in Bland–Altman) should also be evaluated against clinically relevant thresholds and decision-analytic endpoints.
DeepCTE3D showed solid performance in generating accurate ICV and LVV masks for most CT scans; however, validation also revealed challenging scenarios. Cases with concurrent conditions–such as hydrocephalus and severe white-matter disease–introduced additional image-level complexity (ventricular morphology changes and white-matter hypoattenuation that can blur ventricular boundaries) and challenged automated delineation. Although these errors were uncommon, they carry clinical relevance because LVV misestimation may delay recognition of ventricular enlargement or trigger false positives in borderline cases. Our qualitative analysis of outliers (those with the largest deviations between DeepCTE3D and GT) found that most were normal scans, which aligns with the screening function of head CT and thus commonly yields normal or age-appropriate results. This pattern also suggests two non-exclusive explanations: (i) the 5th-percentile threshold used to flag outliers may be overly sensitive, and/or (ii) subtle training-data biases may hinder performance on normal scans. Separately, the apparent failures in hydrocephalus likely reflect the underrepresentation of such cases in our data, limiting our ability to characterize performance for this condition. Taken together, these observations underscore the need for targeted model refinements to improve generalizability.
DeepCTE3D’s ability to account for volumetric variations across all age groups and sexes, in both normal and abnormal cases, suggests its potential application as a triage tool. By optimizing the model and incorporating normative CT data, this targeted approach could be further refined to streamline clinical workflow. This process is similar to existing MRI-focused tools such as NeuroQuant, which integrate population normative data into reports to aid radiologists in interpreting segmentation results61. In such a system, DeepCTE3D would flag critical scans for prompt interpretation and management, allowing radiologists to prioritize their workload and potentially improve patient outcomes6,8,9. In addition, by providing more consistent and objective ICV and LVV measurements than traditional visual reading, DeepCTE3D can improve diagnostic accuracy, abnormality detection, and agreement between radiologists27.
This study has limitations. It was conducted at a single tertiary hospital, which may restrict the generalizability of the findings. The validation dataset presents imbalances in scanner vendors and pathological categories, and the training dataset used for model development was sex-imbalanced, which likely contributed to the higher overestimation bias observed in female patients. These characteristics are typical of real-world hospital data, which, while potentially introducing bias, also enhance ecological validity by reflecting the diversity of clinical practice. Moreover, the qualitative review of 27 outlier cases was intentionally exploratory and based on an empirical 5th-percentile threshold for pattern discovery. Future studies should adopt balanced sampling across scanner vendor, reconstruction kernel, slice thickness, age, and sex to support fair and generalizable estimates.
Conclusion
This study presents an initial, real-world validation of DeepCTE3D for CT-based segmentation of intracranial and ventricular volumes. In a heterogeneous, all-comers cohort, ICV segmentation showed robust and stable performance, whereas LVV results were slightly lower and more sensitive to acquisition and technical factors, indicating areas for refinement. While these findings support the reliability of ICV estimates, the clinical significance of LVV differences remains to be established through outcome-oriented evaluations in future studies. DeepCTE3D contributes to expanding AI-based image analysis to CT, a modality often used when MRI is contraindicated or unavailable, thereby enhancing the accessibility of automated volumetric assessment in diverse clinical contexts.
Data availability
The data and code generated in this study are available upon reasonable request from the corresponding author.
References
-
Do, K.-H., Beck, K. S. & Lee, J. M. The growing problem of radiologist shortages: Korean perspective. Korean Journal of Radiology 24, 1173 (2023).
Article PubMed PubMed Central Google Scholar
-
Alexander, R. et al. Mandating limits on workload, duty, and speed in radiology. Radiology 304, 274–282 (2022).
Article PubMed PubMed Central Google Scholar
-
Rawson, J. V., Rubin, E. & Smetherman, D. Short-term strategies for augmenting the national radiologist workforce. Am. J. Roentgenol. (2024).
-
Liu, X. et al. A comparison of deep learning performance against health-care professionals in detecting diseases from medical imaging: a systematic review and meta-analysis. The lancet digital health 1, e271–e297 (2019).
Article PubMed Google Scholar
-
Cheng, P. M. et al. Deep learning: an update for radiologists. Radiographics 41, 1427–1445 (2021).
Article PubMed Google Scholar
-
Najjar, R. Redefining radiology: A review of artificial intelligence integration in medical imaging. Diagnostics, 13 (17), 2760 (2023).
-
Lui, Y. et al. Artificial intelligence in neuroradiology: current status and future directions. American Journal of Neuroradiology 41, E52–E59 (2020).
CAS PubMed PubMed Central Google Scholar
-
Yao, A. D., Cheng, D. L., Pan, I. & Kitamura, F. Deep learning in neuroradiology: a systematic review of current algorithms and approaches for the new wave of imaging technology. Radiol. Artif. Intell. 2, e190026 (2020).
-
O’neill, T. J. Active reprioritization of the reading worklist using artificial intelligence has a beneficial effect on the turnaround time for interpretation of head ct with intracranial hemorrhage. Radiol. Artif. Intell. 3, e200024 (2020).
-
Czap, A. L. & Sheth, S. A. Overview of imaging modalities in stroke. Neurology 97, S42–S51 (2021).
Article PubMed PubMed Central Google Scholar
-
Cortés-Ferre, L., Gutiérrez-Naranjo, M. A., Egea-Guerrero, J. J., Pérez-Sánchez, S. & Balcerzyk, M. Deep learning applied to intracranial hemorrhage detection. Journal of Imaging 9, 37 (2023).
Article PubMed PubMed Central Google Scholar
-
Chilamkurthy, S. et al. Deep learning algorithms for detection of critical findings in head ct scans: a retrospective study. The Lancet 392, 2388–2396 (2018).
Article Google Scholar
-
Topff, L. et al. Artificial intelligence tool for detection and worklist prioritization reduces time to diagnosis of incidental pulmonary embolism at ct. Radiol. Cardiothorac. Imaging 5, e220163 (2023).
-
Cai, J. C. et al. Fully automated segmentation of head ct neuroanatomy using deep learning. Radiology: Artificial Intelligence 2, e190183 (2020).
-
Pahwa, B., Bali, O., Goyal, S. & Kedia, S. Applications of machine learning in pediatric hydrocephalus: a systematic review. Neurology India 69, S380–S389 (2021).
Article PubMed Google Scholar
-
Maragkos, G. A. et al. Automated lateral ventricular and cranial vault volume measurements in 13,851 patients using deep learning algorithms. World Neurosurgery 148, e363–e373 (2021).
Article PubMed Google Scholar
-
Malone, I. B. et al. Accurate automatic estimation of total intracranial volume: a nuisance variable with less nuisance. Neuroimage 104, 366–372 (2015).
Article PubMed Google Scholar
-
Nawaz, M. S. et al. Thirty novel sequence variants impacting human intracranial volume. Brain Commun. 4, fcac271 (2022).
-
Caspi, Y. et al. Automatic measurements of fetal intracranial volume from 3d ultrasound scans. Frontiers in Neuroimaging 1, 996702 (2022).
Article PubMed PubMed Central Google Scholar
-
Van Loenhoud, A. C., Groot, C., Vogel, J. W., Van Der Flier, W. M. & Ossenkoppele, R. Is intracranial volume a suitable proxy for brain reserve?. Alzheimer’s research & therapy 10, 1–12 (2018).
Google Scholar
-
Fang, C., Ji, M., Dong, C., Li, J. & Ye, X. Comparing the increased intracranial volume from different surgical methods for syndromic craniosynostosis. Journal of Craniofacial Surgery 33, 2529–2533 (2022).
Article PubMed PubMed Central Google Scholar
-
Cheong, J. L. et al. Head growth in preterm infants: correlation with magnetic resonance imaging and neurodevelopmental outcome. Pediatrics 121, e1534–e1540 (2008).
Article PubMed Google Scholar
-
Chen, J. V. et al. Automated neonatal nnu-net brain mri extractor trained on a large multi-institutional dataset. Scientific Reports 14, 4583 (2024).
Article ADS PubMed PubMed Central Google Scholar
-
Hoopes, A., Mora, J. S., Dalca, A. V., Fischl, B. & Hoffmann, M. Synthstrip: skull-stripping for any brain image. NeuroImage 260, 119474 (2022).
Article PubMed PubMed Central Google Scholar
-
Kartal, M. G. & Algin, O. Evaluation of hydrocephalus and other cerebrospinal fluid disorders with mri: An update. Insights into imaging 5, 531–541 (2014).
Article PubMed PubMed Central Google Scholar
-
Haller, S., Jäger, H. R., Vernooij, M. W. & Barkhof, F. Neuroimaging in dementia: more than typical alzheimer disease. Radiology 308, e230173 (2023).
Article PubMed Google Scholar
-
Hedderich, D. M. et al. Normative brain volume reports may improve differential diagnosis of dementing neurodegenerative diseases in clinical practice. European Radiology 30, 2821–2829 (2020).
Article PubMed Google Scholar
-
Yepes-Calderon, F. & McComb, J. G. Accurate image-based csf volume calculation of the lateral ventricles. Scientific Reports 12, 12115 (2022).
Article ADS CAS PubMed PubMed Central Google Scholar
-
Kocaman, H., Acer, N., Köseoğlu, E., Gültekin, M. & Dönmez, H. Evaluation of intracerebral ventricles volume of patients with parkinson’s disease using the atlas-based method: A methodological study. Journal of Chemical Neuroanatomy 98, 124–130 (2019).
Article PubMed Google Scholar
-
Huff, T. J., Ludwig, P. E., Salazar, D. & Cramer, J. A. Fully automated intracranial ventricle segmentation on ct with 2d regional convolutional neural network to estimate ventricular volume. International journal of computer assisted radiology and surgery 14, 1923–1932 (2019).
Article PubMed Google Scholar
-
Jóhannsdóttir, A. M., Pedersen, C. B., Munthe, S., Poulsen, F. R. & Jóhannsson, B. Idiopathic normal pressure hydrocephalus: validation of the desh score as a prognostic tool for shunt surgery response. Clinical Neurology and Neurosurgery 108295 (2024).
-
Mofrad, S. A. et al. A predictive framework based on brain volume trajectories enabling early detection of alzheimer’s disease. Computerized Medical Imaging and Graphics 90, 101910 (2021).
Article PubMed Google Scholar
-
3d slicer webpage. https://www.slicer.org/. Accessed: 2024-03-13.
-
Kikinis, R., Pieper, S. D. & Vosburgh, K. G. 3d slicer: a platform for subject-specific image analysis, visualization, and clinical support. In Intraoperative imaging and image-guided therapy, 277–289 (Springer, 2013).
-
Jolesz, F. A. Intraoperative imaging and image-guided therapy (Springer Science & Business Media, 2014).
-
Slicer docker. https://github.com.mcas.ms/Slicer/SlicerDocker/tree/main/slicer-notebook.
-
Trame. https://trameapp.kitware.com/, note = Accessed: 2023-09-30.
-
Stonebraker, M. & Rowe, L. A. The design of postgres. Tech. Rep. ERL-M85-95, University of California, Department of Electrical Engineering and Computer Sciences (1985). Accessed: 2025-08-13.
-
Moraes, L. et al. Multi-task deep learning model for the automated segmentation of neuroimages in real-world ct scans. Available at SSRN 4630905 (2022).
-
Python Software Foundation. Python programming language. https://docs.python.org/3.9/reference/index.html (2022). Accessed: April 1, 2024.
-
KL, G. Computing inter-rater reliability and its variance in the presence of high agreement. British Journal of Mathematical and Statistical Psychology 61(Pt 1), 29–48 (2008).
-
Landis, J. & Koch, G. G. The measurement of observer agreement for categorical data. Biometrics 33(Pt 1), 159–174 (1977).
Article CAS PubMed Google Scholar
-
Tomczak M., E., Tomczak. The need to report effect size estimates revisited. an overview of some recommended measures of effect size. TRENDS in Sport Sciences 1(21), 19–25 (2014).
-
Cohen, J. Statistical Power Analysis for the Behavioral Sciences, 2nd edn (ed Lawrence Erlbaum Associates, New York, 1988).
-
Billot, B. et al. SynthSeg: Segmentation of brain MRI scans of any contrast and resolution without retraining. Medical Image Analysis 86, 102789. https://doi.org/10.1016/j.media.2023.102789 (2023).
Article PubMed PubMed Central Google Scholar
-
Isensee, F., Jaeger, P. F., Kohl, S. A. A., Petersen, J. & Maier-Hein, K. H. nnU-Net: a self-configuring method for deep learning-based biomedical image segmentation. Nature Methods 18, 203–211. https://doi.org/10.1038/s41592-020-01008-z (2021).
Article CAS PubMed Google Scholar
-
He, X. et al. Location-aware upsampling for semantic segmentation. arXiv preprint arXiv:1911.05250 (2019).
-
Kervadec, H. et al. Boundary loss for highly unbalanced segmentation. In International conference on medical imaging with deep learning, 285–296 (PMLR, 2019).
-
Quon, J. L. et al. Artificial intelligence for automatic cerebral ventricle segmentation and volume calculation: a clinical tool for the evaluation of pediatric hydrocephalus. Journal of neurosurgery: Pediatrics 27, 131–138 (2020).
PubMed PubMed Central Google Scholar
-
Szentimrey, Z., de Ribaupierre, S., Fenster, A. & Ukwatta, E. Automated 3d u-net based segmentation of neonatal cerebral ventricles from 3d ultrasound images. Medical Physics 49, 1034–1046 (2022).
Article ADS PubMed Google Scholar
-
Klimont, M. et al. Automated ventricular system segmentation in paediatric patients treated for hydrocephalus using deep learning methods. BioMed research international 2019 (2019).
-
Zhou, X. et al. Systematic and comprehensive automated ventricle segmentation on ventricle images of the elderly patients: a retrospective study. Frontiers in Aging Neuroscience 12, 618538 (2020).
Article PubMed PubMed Central Google Scholar
-
Pei, L. et al. A general skull stripping of multiparametric brain mris using 3d convolutional neural network. Scientific Reports 12, 10826 (2022).
Article ADS CAS PubMed PubMed Central Google Scholar
-
Ritchie, S. J. et al. Sex differences in the adult human brain: evidence from 5216 uk biobank participants. Cerebral cortex 28, 2959–2975 (2018).
Article PubMed PubMed Central Google Scholar
-
Chung, S.-C. et al. Effects of gender, age, and body parameters on the ventricular volume of korean people. Neuroscience letters 395, 155–158 (2006).
Article CAS PubMed Google Scholar
-
Eliot, L., Ahmed, A., Khan, H. & Patel, J. Dump the “dimorphism’’: Comprehensive synthesis of human brain studies reveals few male-female differences beyond size. Neuroscience & Biobehavioral Reviews 125, 667–697 (2021).
Article Google Scholar
-
Walhovd, K. B. et al. Consistent neuroanatomical age-related volume differences across multiple samples. Neurobiology of aging 32, 916–932 (2011).
Article PubMed Google Scholar
-
Ruigrok, A. N. et al. A meta-analysis of sex differences in human brain structure. Neuroscience & Biobehavioral Reviews 39, 34–50 (2014).
Article Google Scholar
-
Sahu, P. et al. Structure correction for robust volume segmentation in presence of tumors. IEEE Journal of Biomedical and Health Informatics 25, 1151–1162 (2020).
Article Google Scholar
-
Ribeiro, A. H. & Schön, T. B. How convolutional neural networks deal with aliasing (2021). arXiv:2102.07757.
-
Yang, M. H., Kim, E. H., Choi, E. S. & Ko, H. Comparison of normative percentiles of brain volume obtained from neuroquant® vs. deepbrain® in the korean population: correlation with cranial shape. J. Korean Soc. Radiol 84, 1080 (2023).
Download references
Acknowledgements
The authors thank William Yang Chen Fan and Paulo Victor dos Santos for their valuable comments on the manuscript. The authors also thank the research support services of Hospital Israelita Albert Einstein, especially Anderson Paulo Scorsato, for contributions to the development of normative curves related to this line of research. The authors further acknowledge the use of InstaText (https://instatext.io/) for English language editing.
Funding
This project was funded by the Program for Support to the Institutional Development of the Unified Health System (PROADI-SUS, 01/2024; NUP: 25000.156740/2023-25) in collaboration with Hospital Israelita Albert Einstein.
Ethics declarations
Competing interests
The authors declare no competing interests.
Additional information
Publisher’s note
Springer Nature remains neutral with regard to jurisdictional claims in published maps and institutional affiliations.
Supplementary Information
Rights and permissions
Open Access This article is licensed under a Creative Commons Attribution-NonCommercial-NoDerivatives 4.0 International License, which permits any non-commercial use, sharing, distribution and reproduction in any medium or format, as long as you give appropriate credit to the original author(s) and the source, provide a link to the Creative Commons licence, and indicate if you modified the licensed material. You do not have permission under this licence to share adapted material derived from this article or parts of it. The images or other third party material in this article are included in the article’s Creative Commons licence, unless indicated otherwise in a credit line to the material. If material is not included in the article’s Creative Commons licence and your intended use is not permitted by statutory regulation or exceeds the permitted use, you will need to obtain permission directly from the copyright holder. To view a copy of this licence, visit http://creativecommons.org/licenses/by-nc-nd/4.0/.
Reprints and permissions
About this article

Cite this article
Pinto, B.G.G., Olegário, T.M.M., Silva, P.V.A. et al. Clinical validation pipeline of a deep learning model for segmenting and quantifying intracranial and ventricular volumes on computed tomography. Sci Rep 16, 26587 (2026). https://doi.org/10.1038/s41598-026-49678-7
Download citation
-
Received:
-
Accepted:
-
Published:
-
Version of record:
-
DOI: https://doi.org/10.1038/s41598-026-49678-7
Keywords

Related Posts